Helping small & medium‑scale entrepreneurs to get clarity on running their business
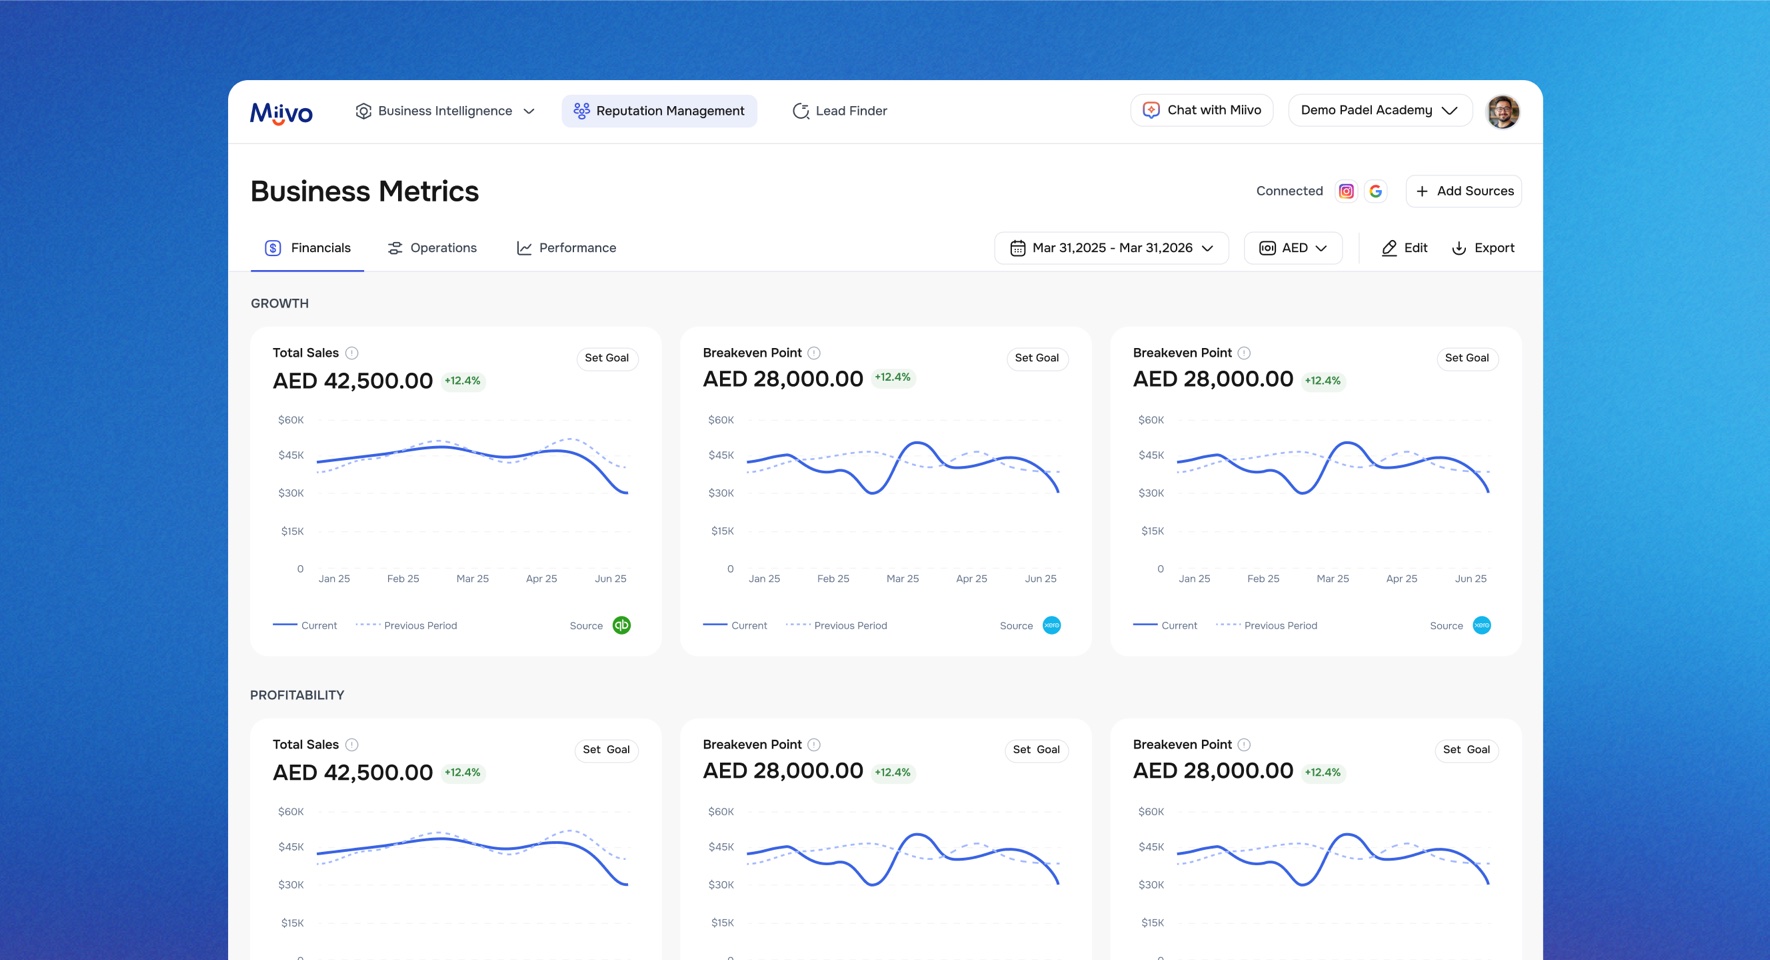

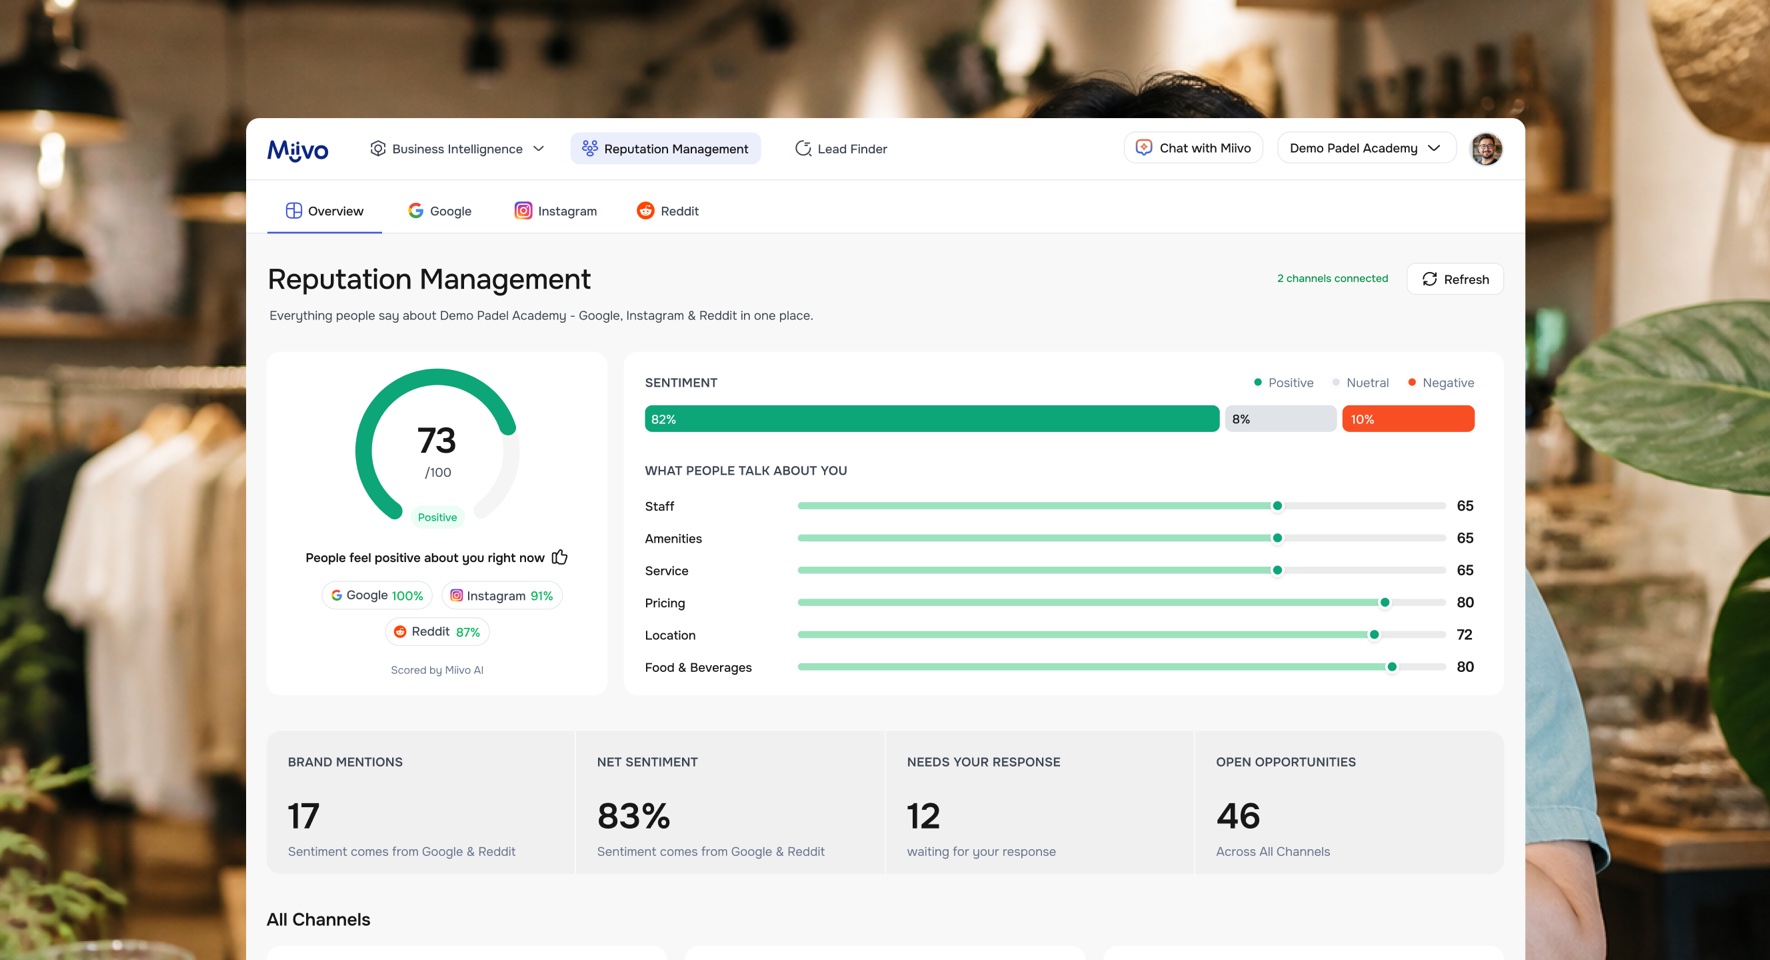
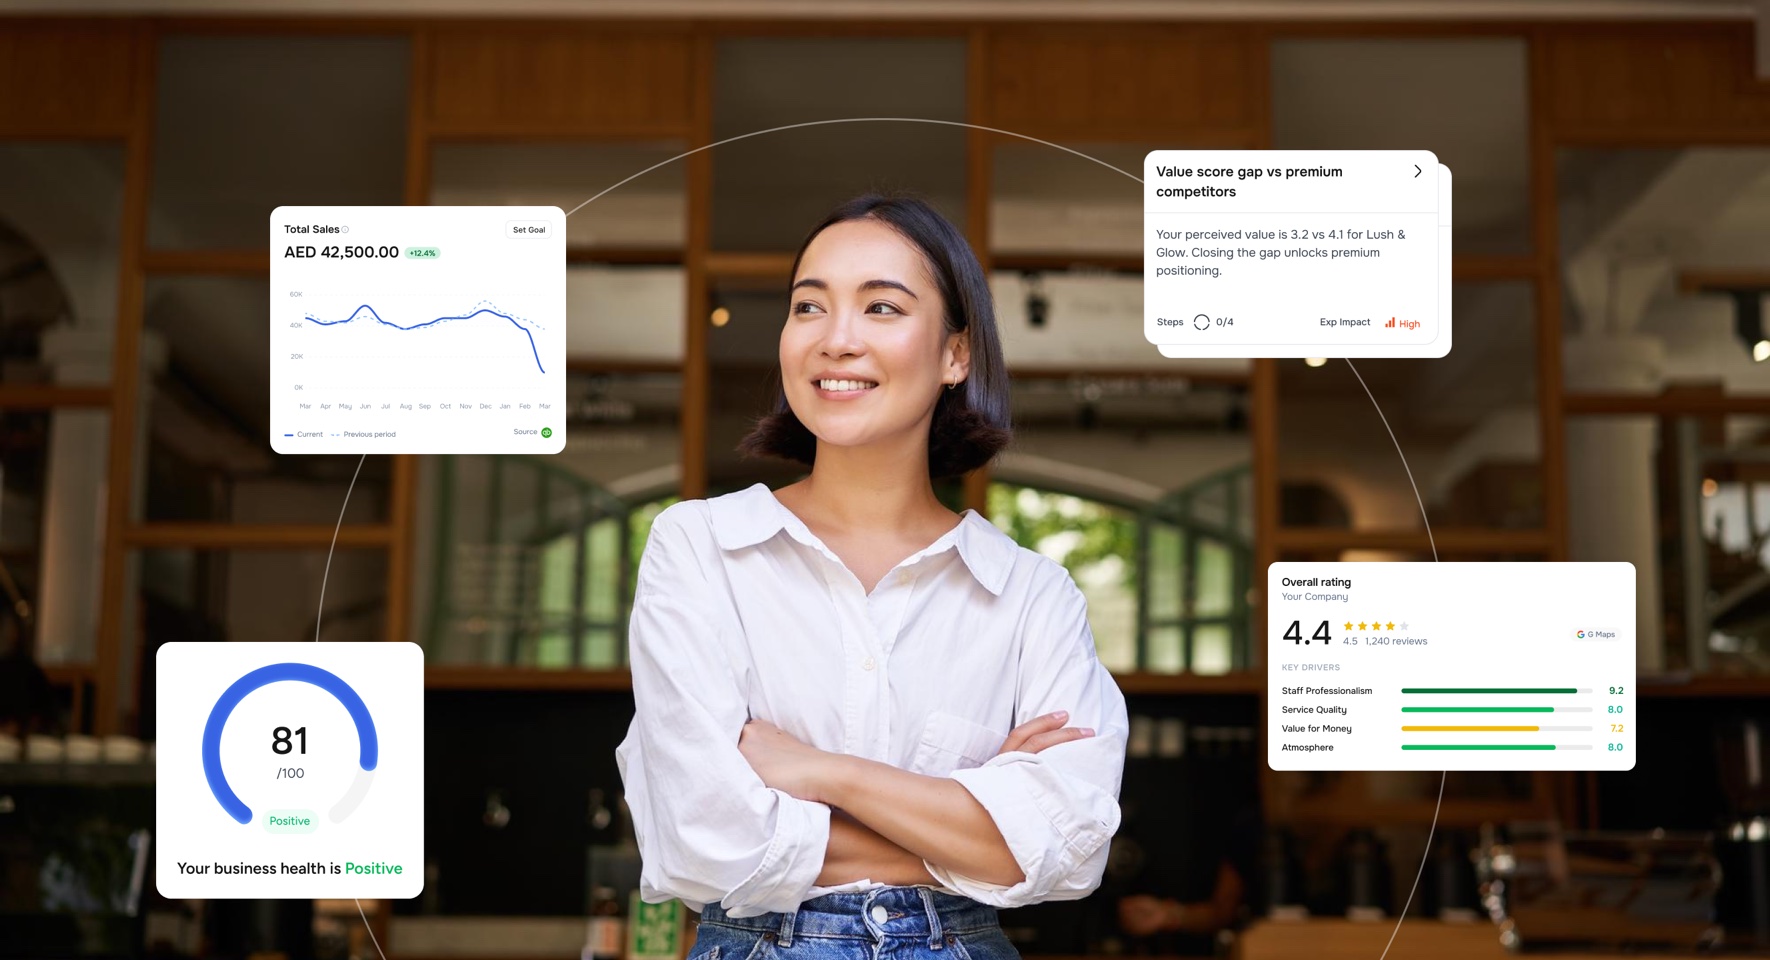
- The product
- A platform bringing business performance, customer signals and possible actions into one experience for SME owners.
- My role
- Founding designer leading 0-to-1 product design across:
- Discovery
- Product flows
- UI and design system
- Prototypes
- Website
- The team
- Working with the co-founders, a product manager and five engineers, including an engineering lead.
Context
SME owners managed finances, operations and customer feedback across separate tools. Accounting systems, spreadsheets and review platforms each held part of the picture, leaving owners to connect the information when making business decisions.
Founders’ view
From their experience as business advisors, the founders saw that owners needed help making sense of their data. They needed to understand what the numbers meant, identify priorities and decide what to do next.

Design sprint
We ran a design sprint with the co-founders to explore the problems SME owners faced with business data, group them into themes and priorities, and decide what to explore first.
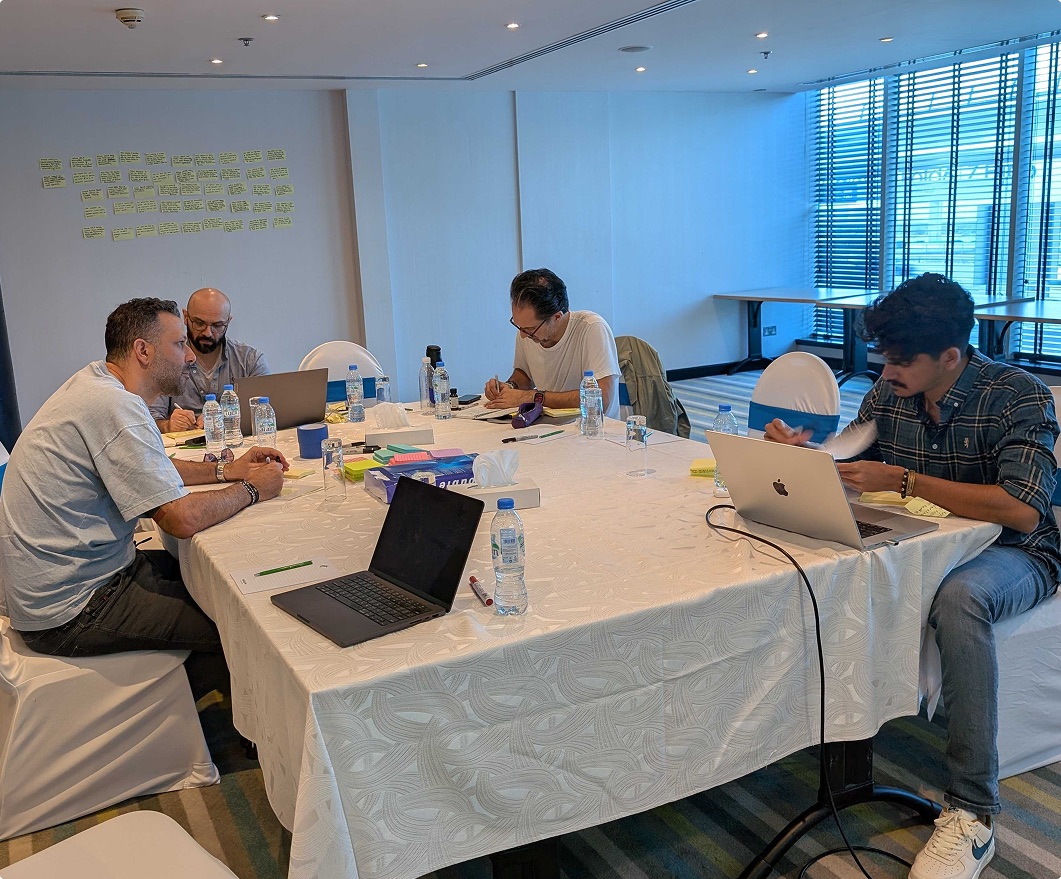
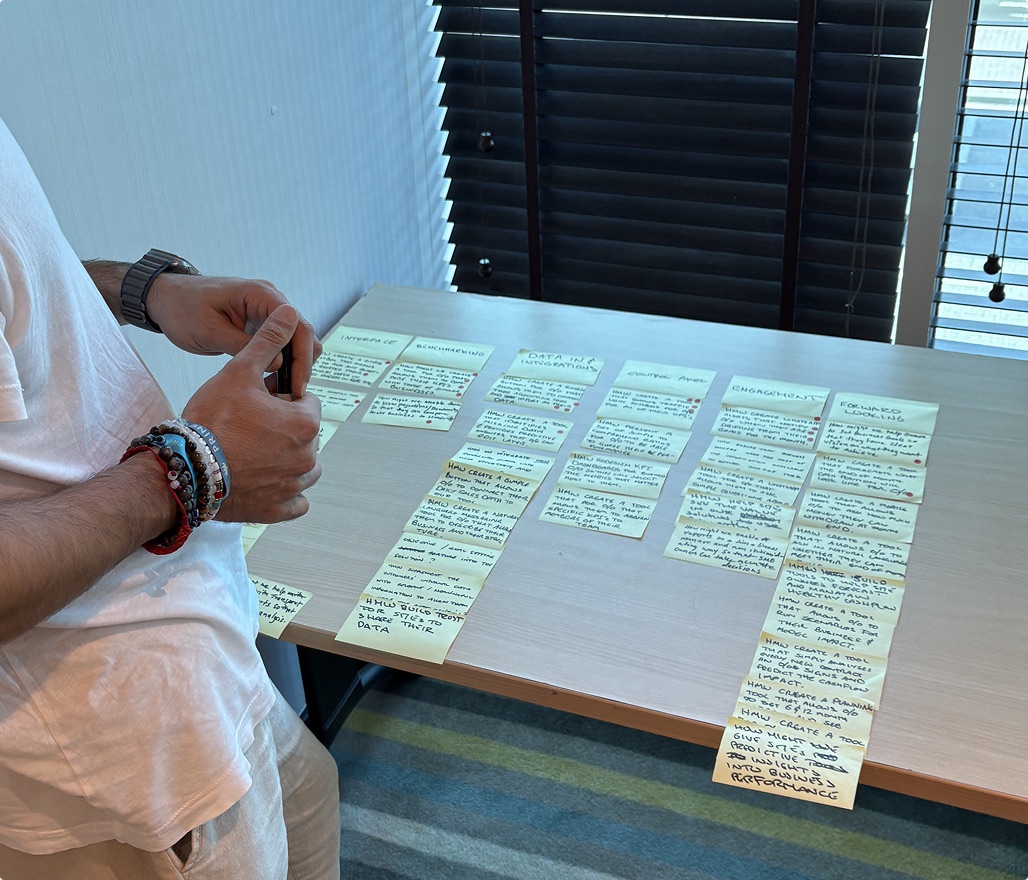
Initial hypotheses from the sprint
- Financial and operational information needed to be considered together to understand the business.
- We discussed customer reviews as another source of context that performance numbers alone could not provide.
- Interpreting changes in the data could help users recognise which issues needed attention.
- Identifying an issue was only a starting point. Suggested actions could help users decide what to do next.
Prototype and SME owner interviews
After the sprint, we built one sample prototype to test the ideas that came out of it. It combined KPIs, insights, suggested actions and an AI surface layer.
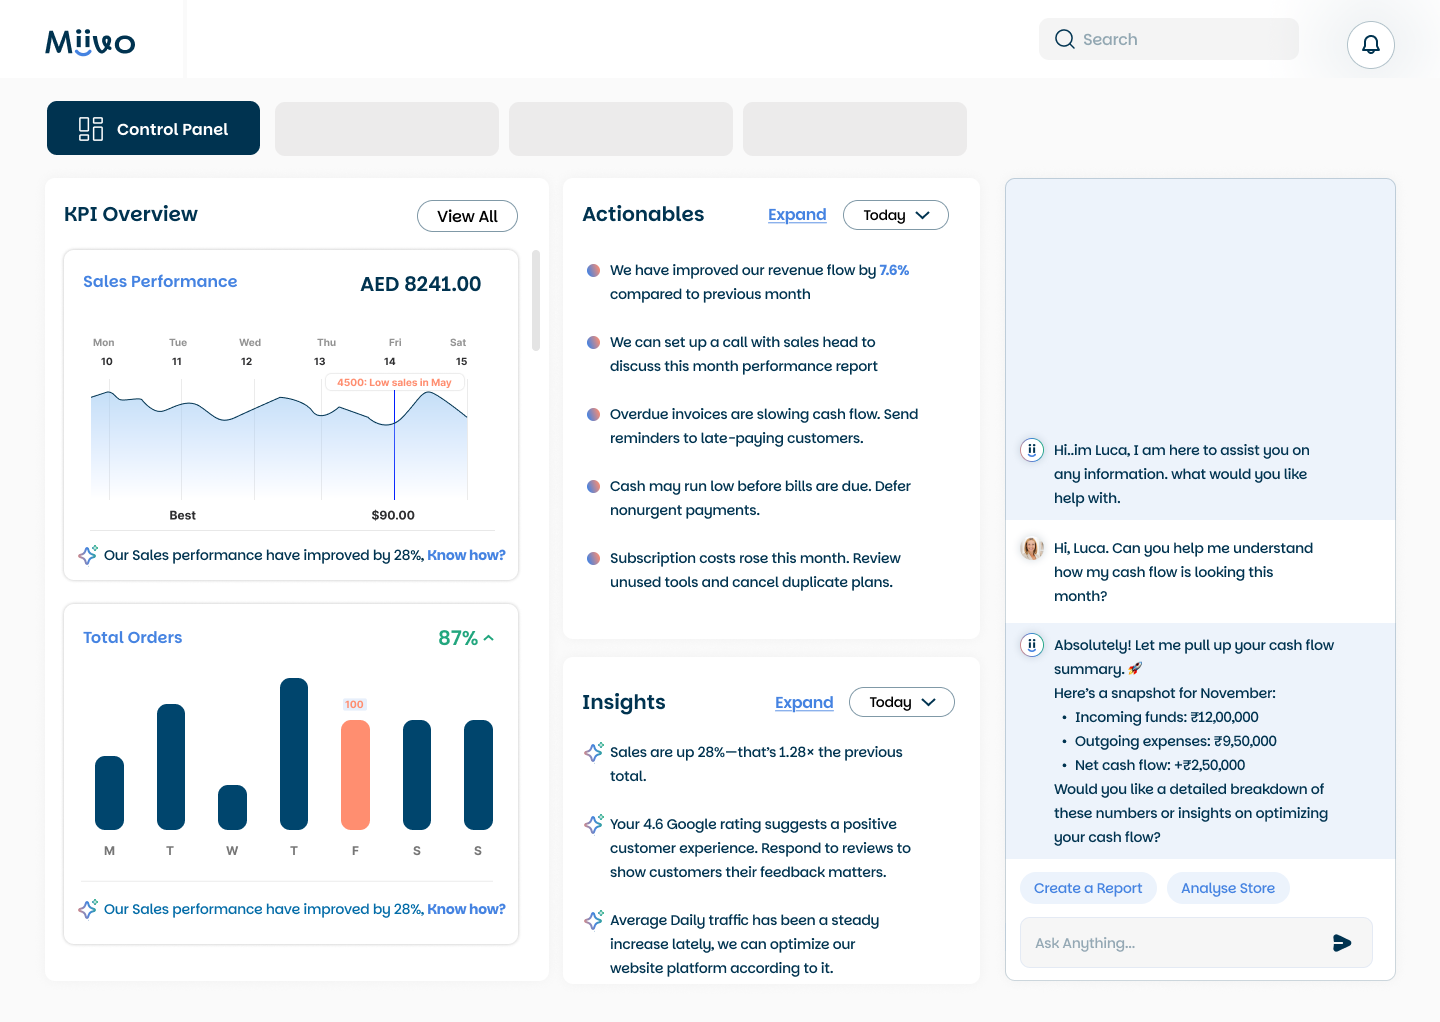
We presented the early prototype to six SME owners over two days.
What users liked
- Their whole business in one place.
- An AI layer to ask questions about their business.
- Suggested actions that felt like practical guidance.
- An advisor they could return to any time.
What users questioned
- Connecting data to a product they did not yet trust.
- Which metrics mattered most, and where they fit.
- Whether suggested actions would improve results.
- Seeing their business through customers’ eyes.
Possible approaches
Four possibilities, assessed with SME owners
The sprint and the prototype gave us four directions for what the product could offer. We used SME owners’ feedback to assess each one before defining the scope.
-
Possibility
Business performance in one view
User valueTrack trends and spot what needs attention
-
Possibility
Customer reviews with context
User valueUnderstand how customers feel and why
-
Possibility
Insights turned into actions
User valueKnow what to improve and the next step
-
Possibility
A conversational AI layer
User valueAsk questions and explore in context
Initial scope
We defined the first framework around three connected areas: understanding performance, interpreting customer feedback and considering possible actions, with an AI surface layer supporting questions across that information.
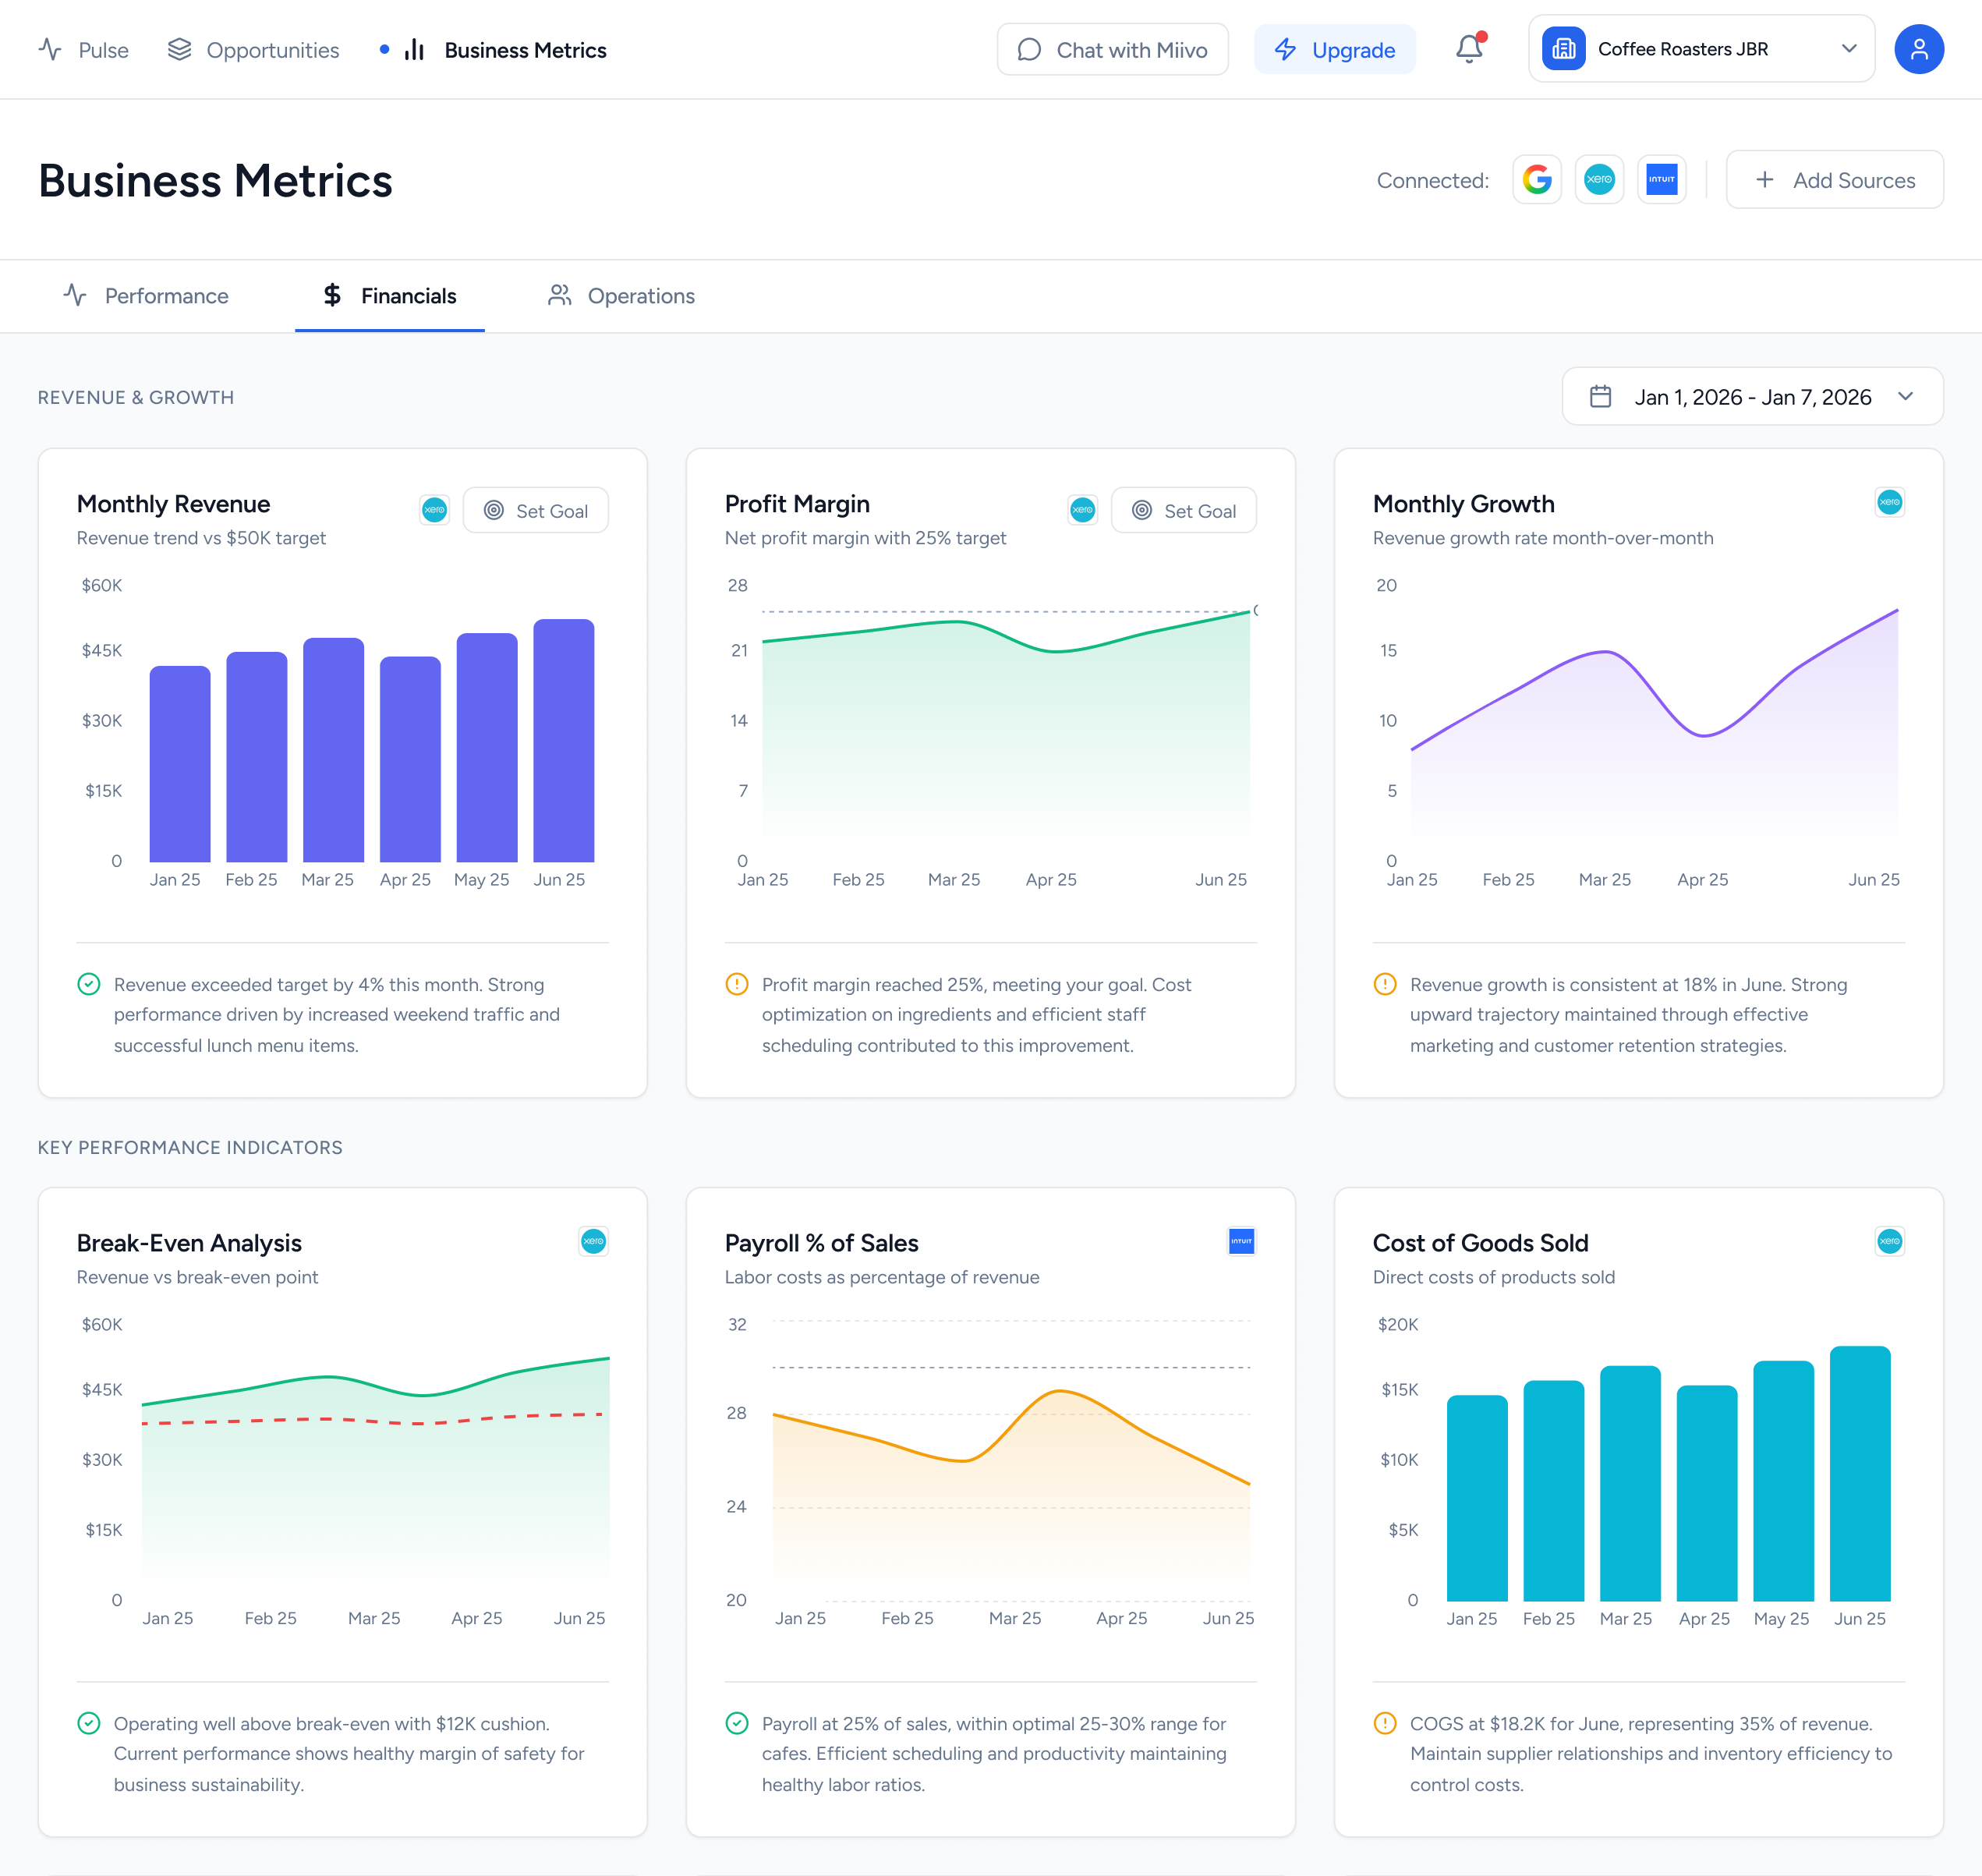
Metrics
Brings financial and operational data into one view, so owners can track performance, spot trends and see what changed.
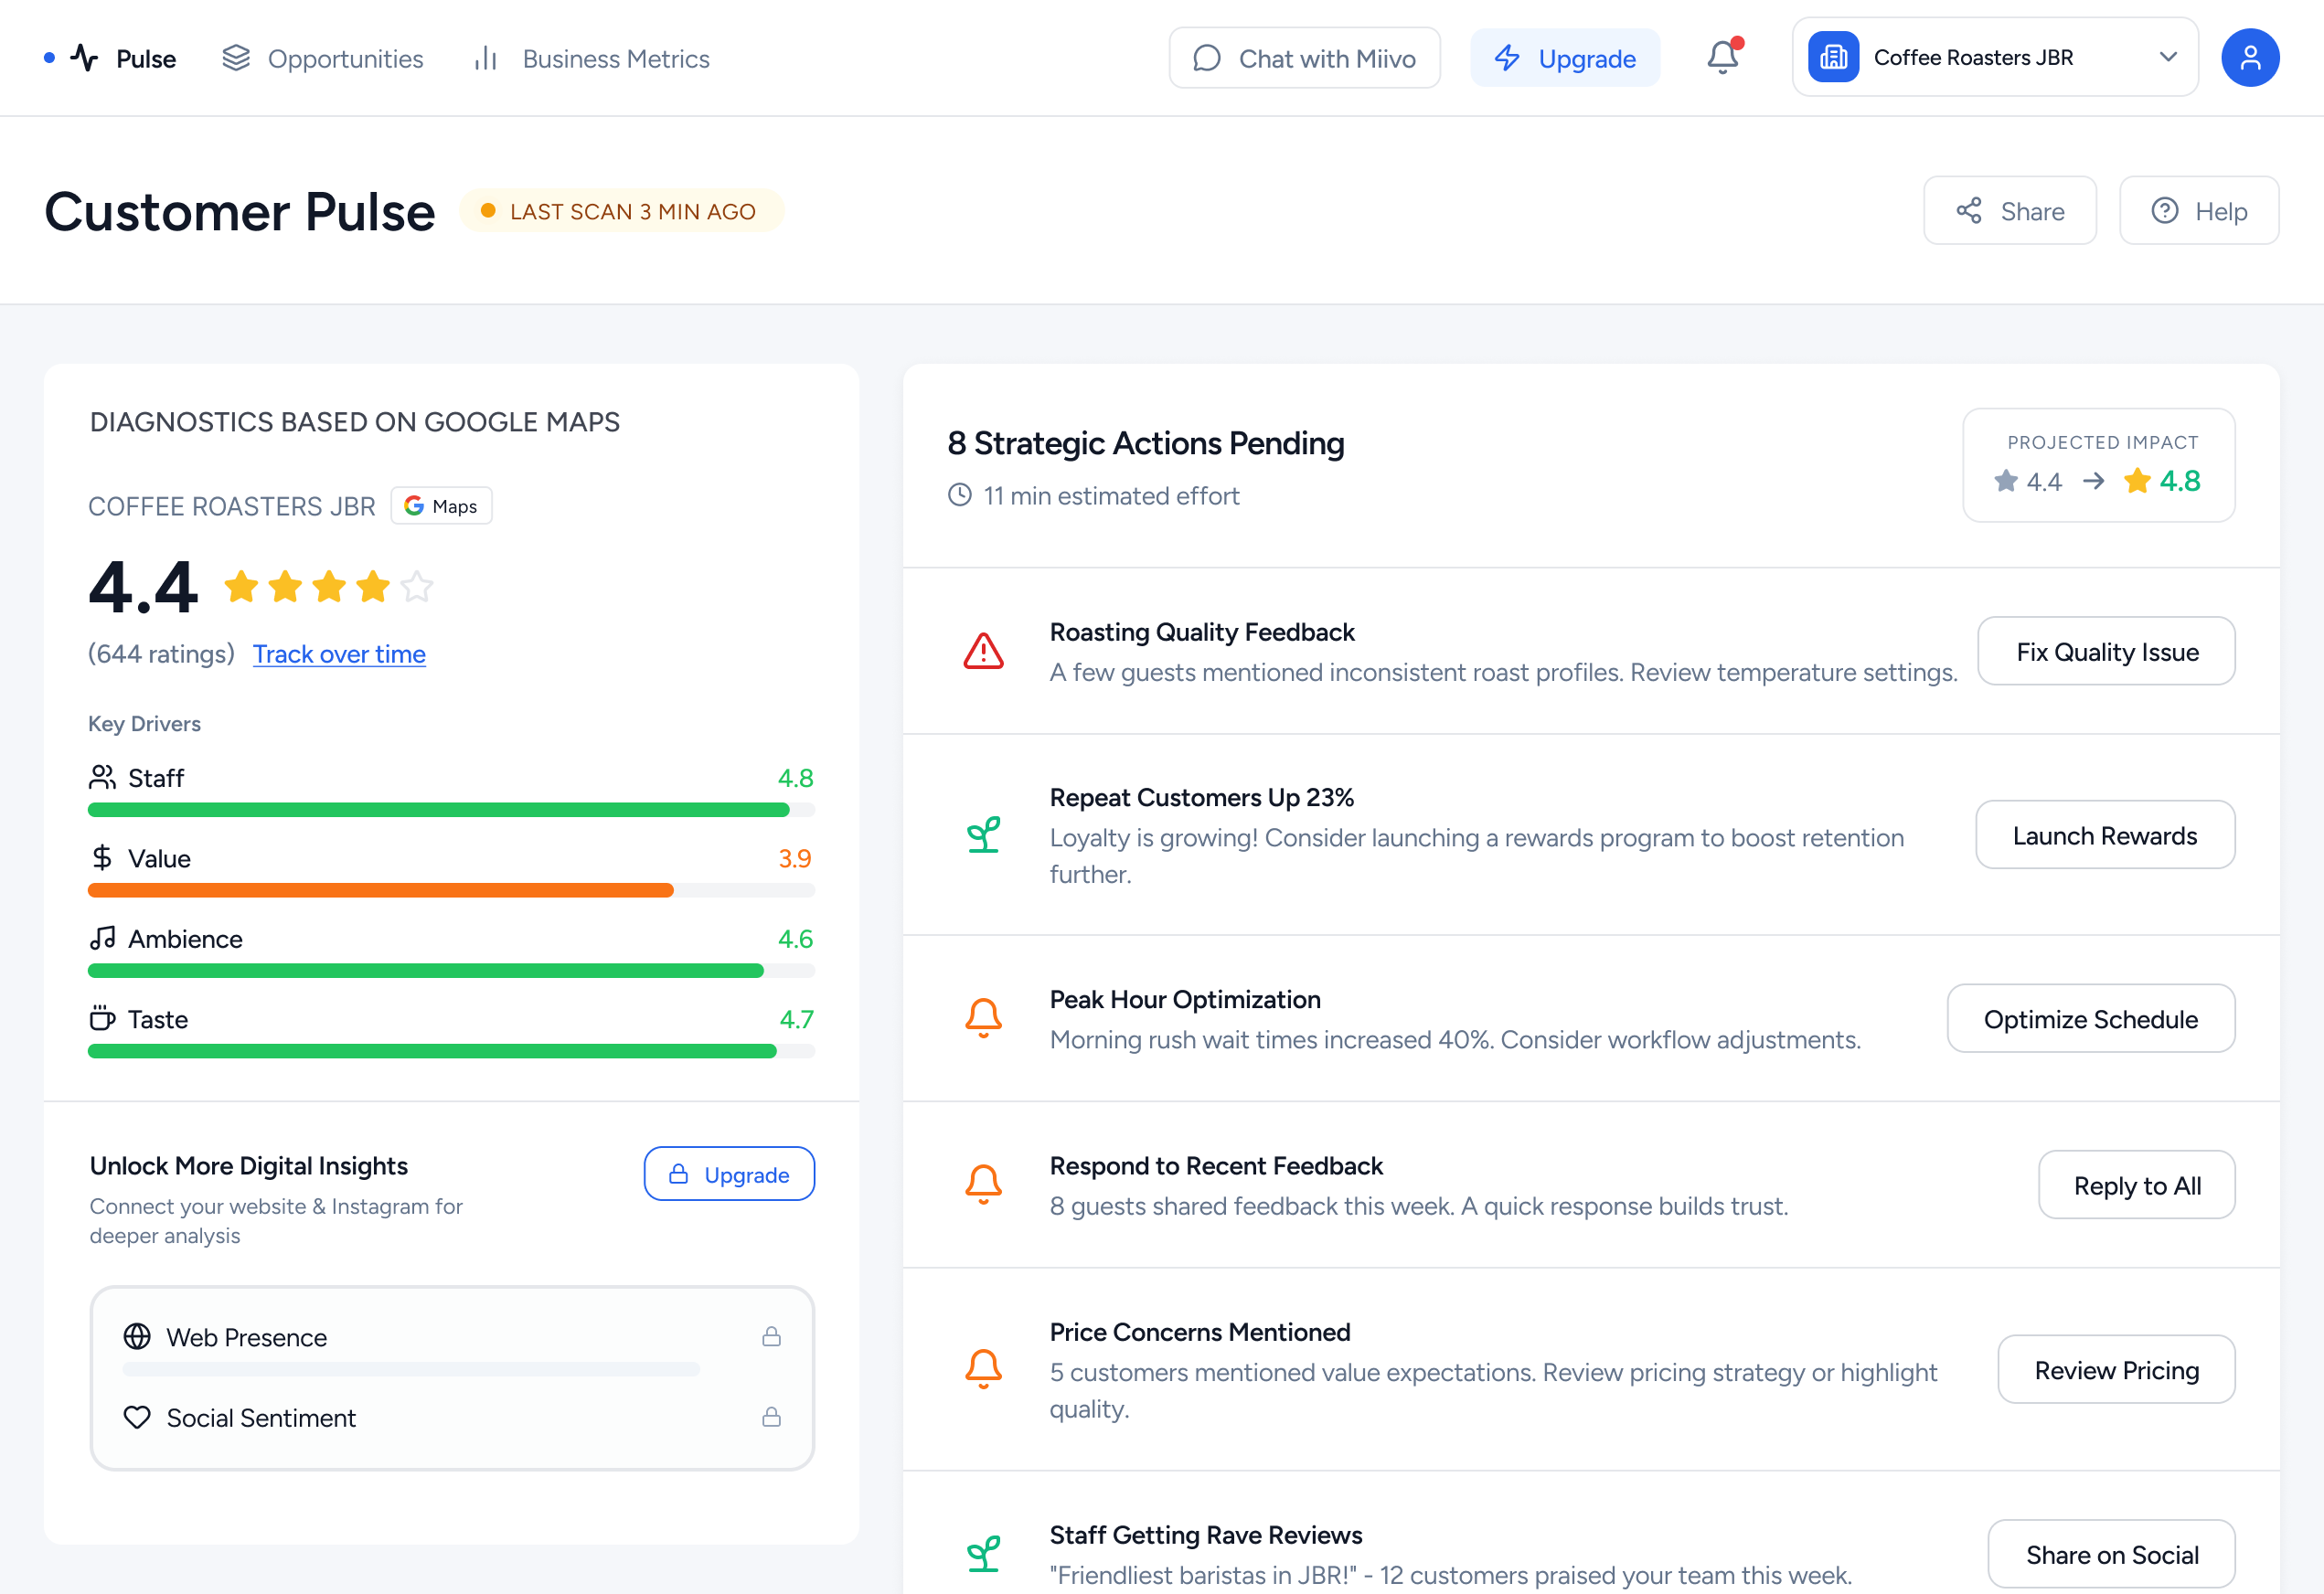
Customer Pulse
Turns ratings and reviews into sentiment and key drivers, so owners see how customers feel and why.
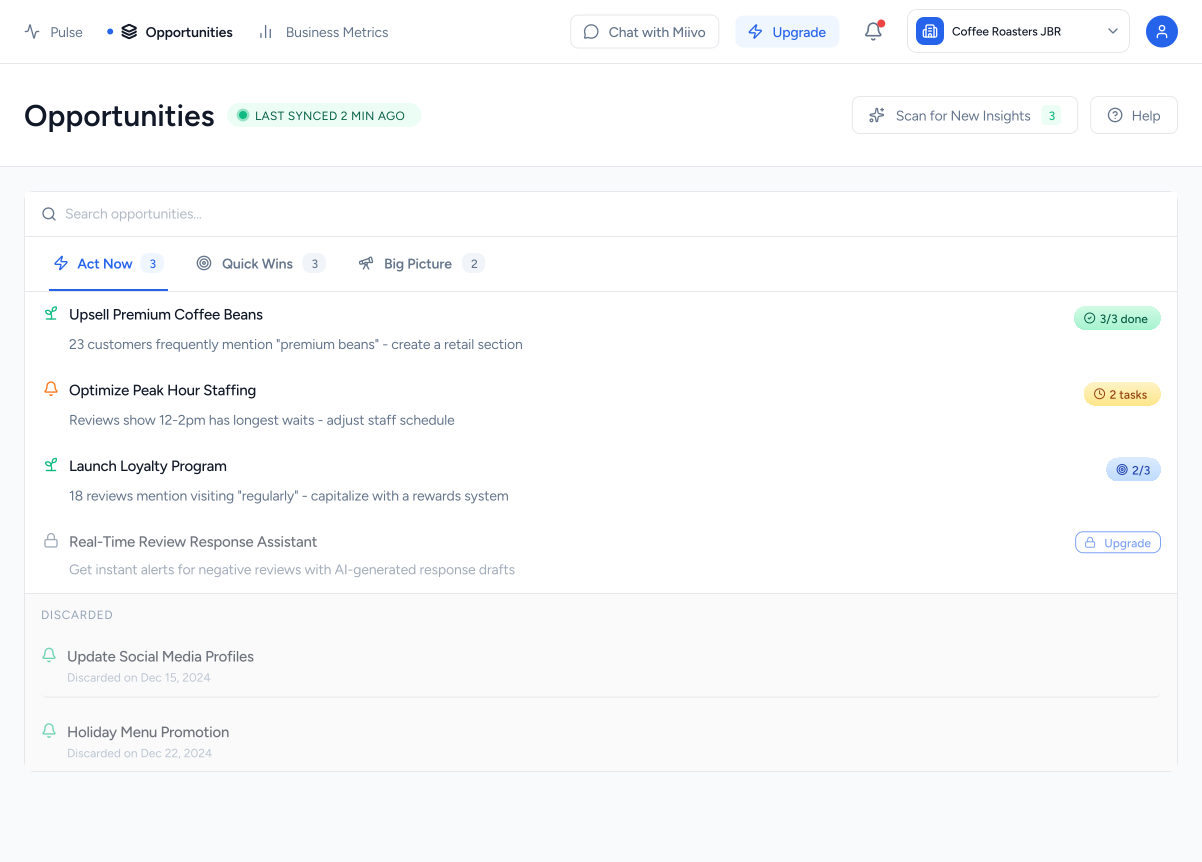
Opportunities
Turns insights into suggested actions with clear next steps, so owners know what to act on.
Translating scope into design
The framework brought a lot of business data into one product, and SME owners had little time to read it. My design approach was to:
- Give each business question its own place.
- Make dense information quick to scan.
- Keep the AI assistant close to the data it explains.
References and approaches
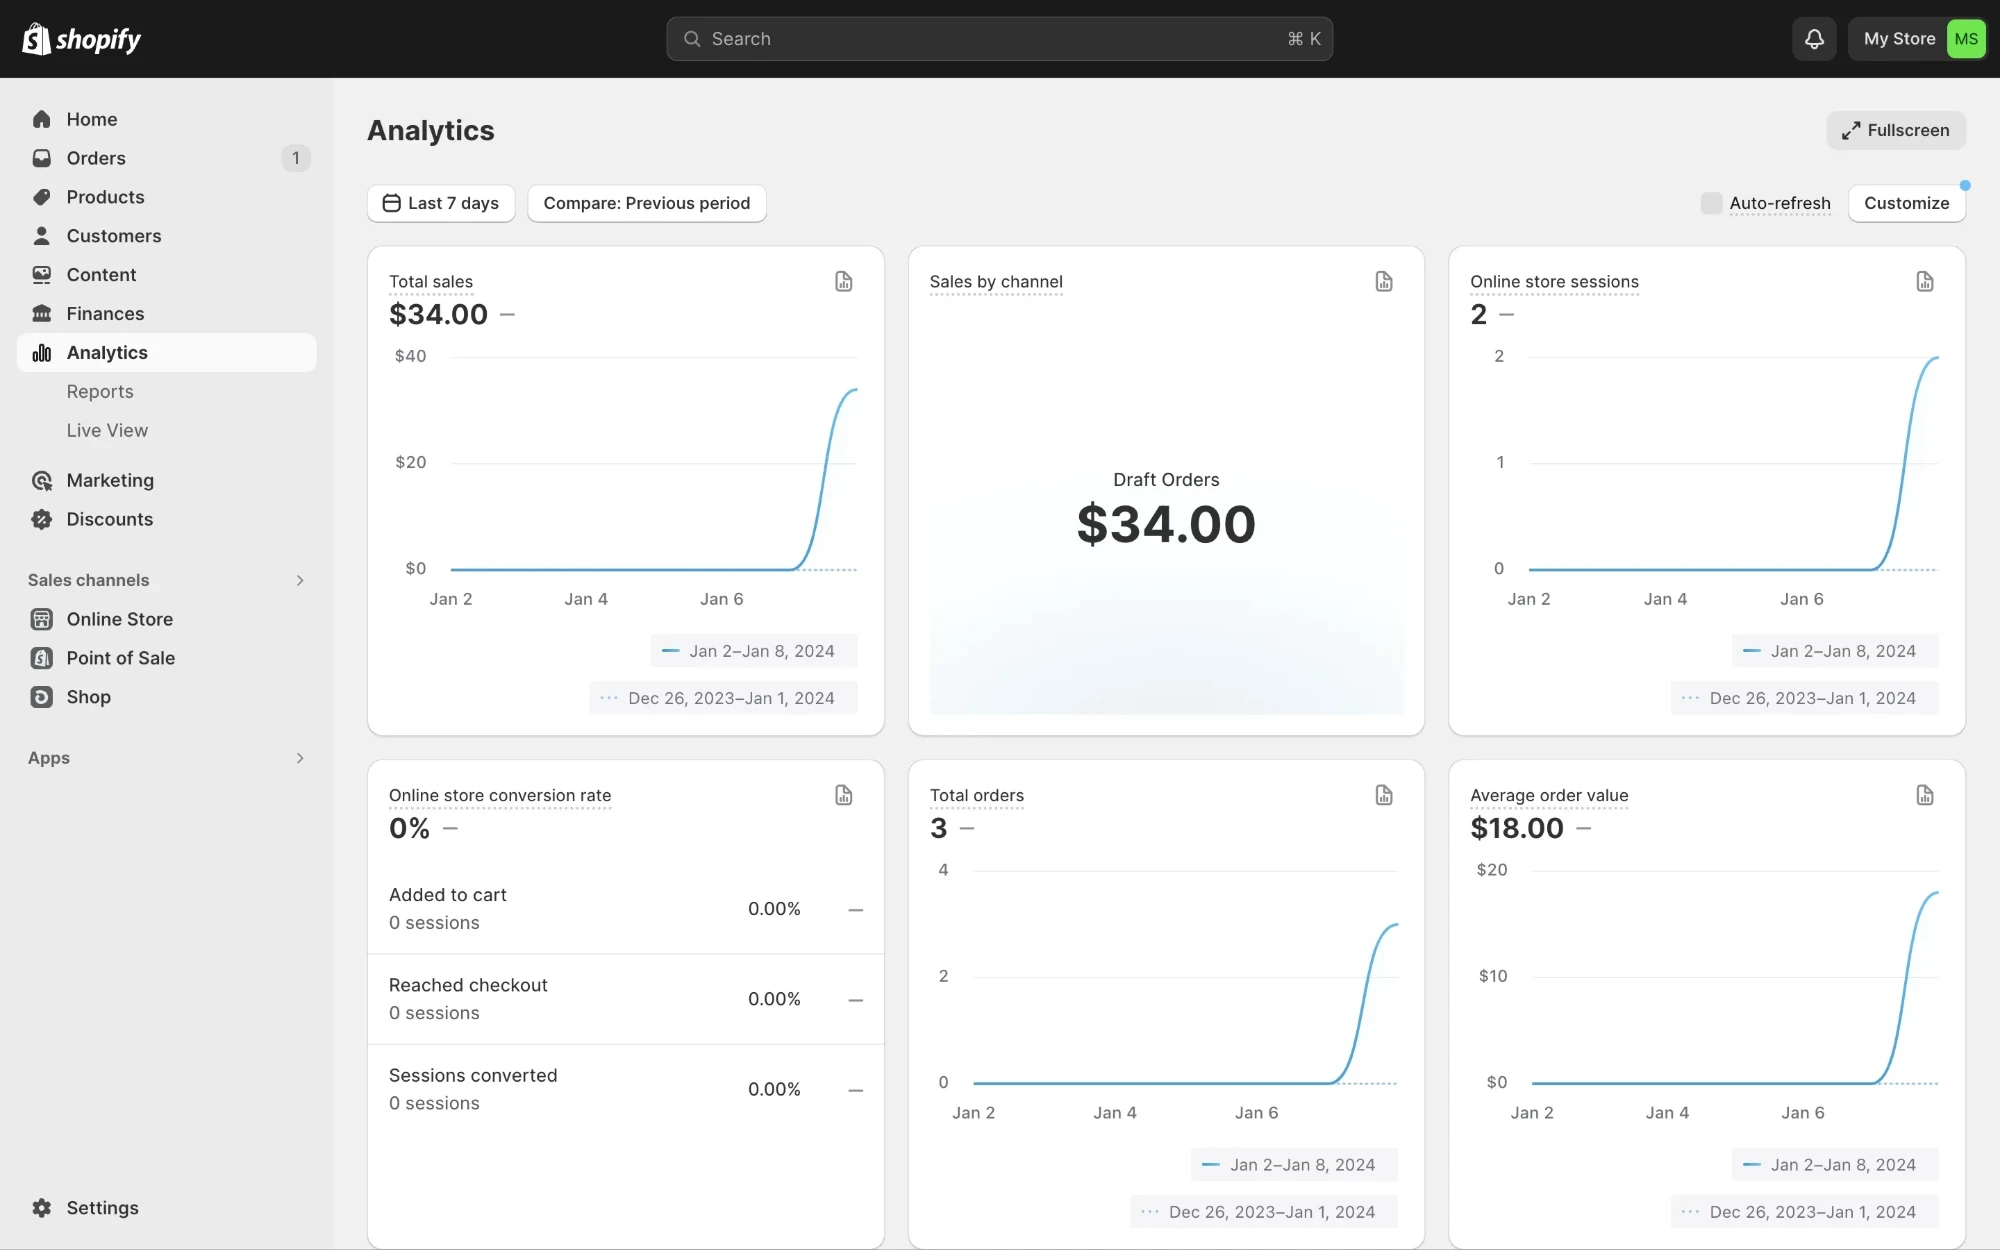
Shopify analytics
Clear charts and easy comparisons between metrics.
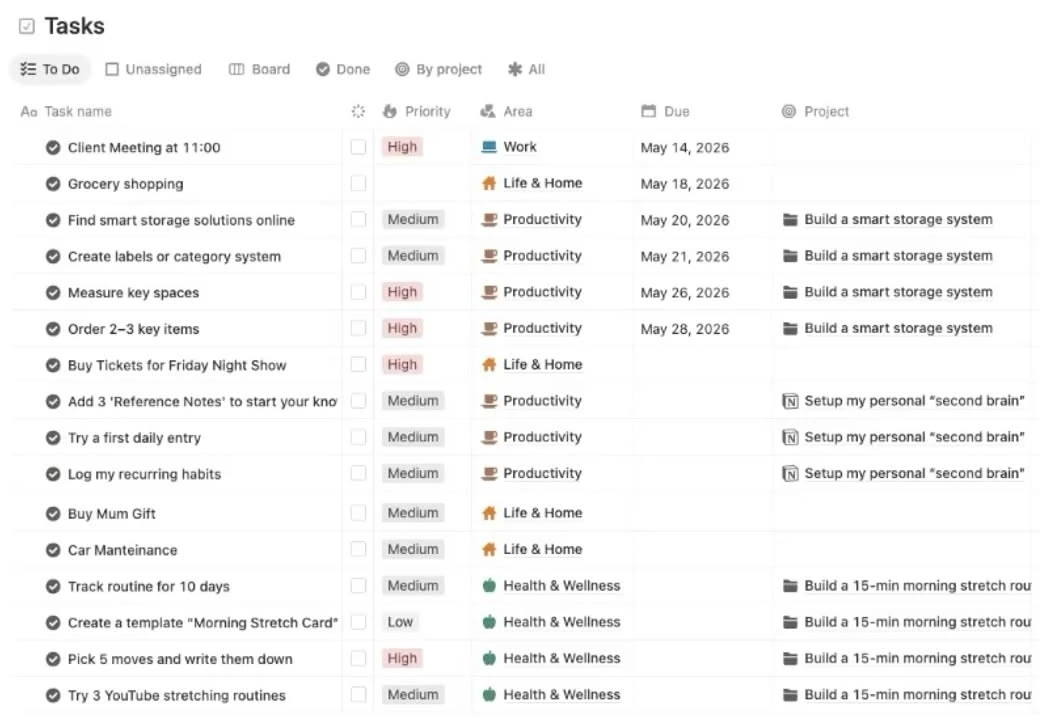
Notion task views
View tabs and priority tags, used to rank Opportunities.
Initial user flow
First framework
Translating the framework into the first product screens
Learning from live use
After building the first framework in three months, we ran it with eight live customers for four months, so the feedback reflected real use before we planned the next phase.
Metrics
The amount of data raised cognitive load, and users still had to work to interpret the insights.
Opportunities
When deciding what to act on, users struggled to judge which suggestions were most important.
Customer Pulse
It relied on Google reviews alone, missing businesses run through Instagram and other channels, with too little data for accuracy.
Onboarding
Engineering input pointed to friction in onboarding, with five to six steps before users reached the product.
We addressed this feedback together in the expanded version.
Product expansion
The expanded version drew on four months of customer use and the stakeholders’ plan to grow Miivo. My challenge was to improve what existed, design what was new and give every feature a clear place.
Refined from live use
Metrics
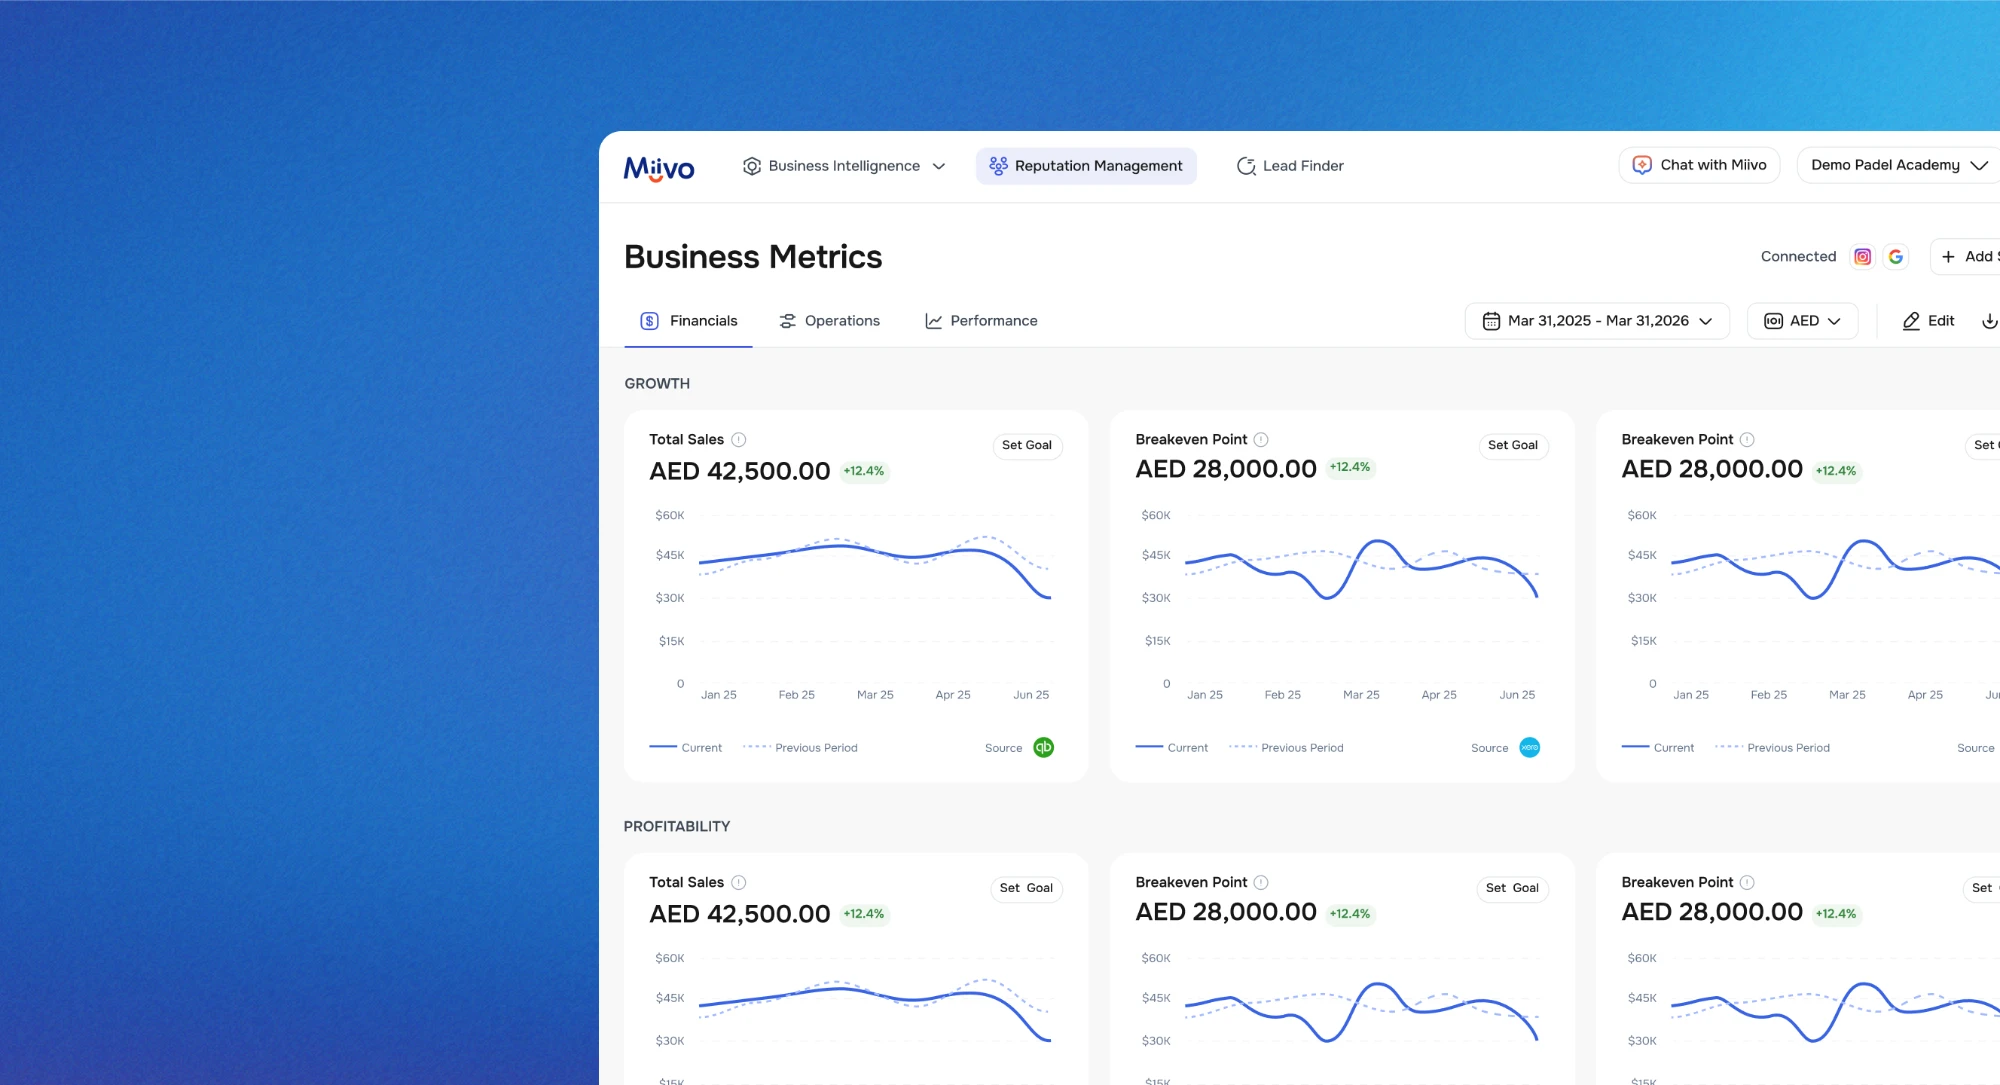
Cut the clutter so key numbers lead, with a clear path into Opportunities.
Opportunities
Make urgency, effort and impact visible, so owners know what to act on first.
Customer Pulse
Read reviews from every channel as a clear score, its drivers and next actions.
Onboarding
Redesign the steps around fetched details, so owners can confirm, not type.
Refined screens
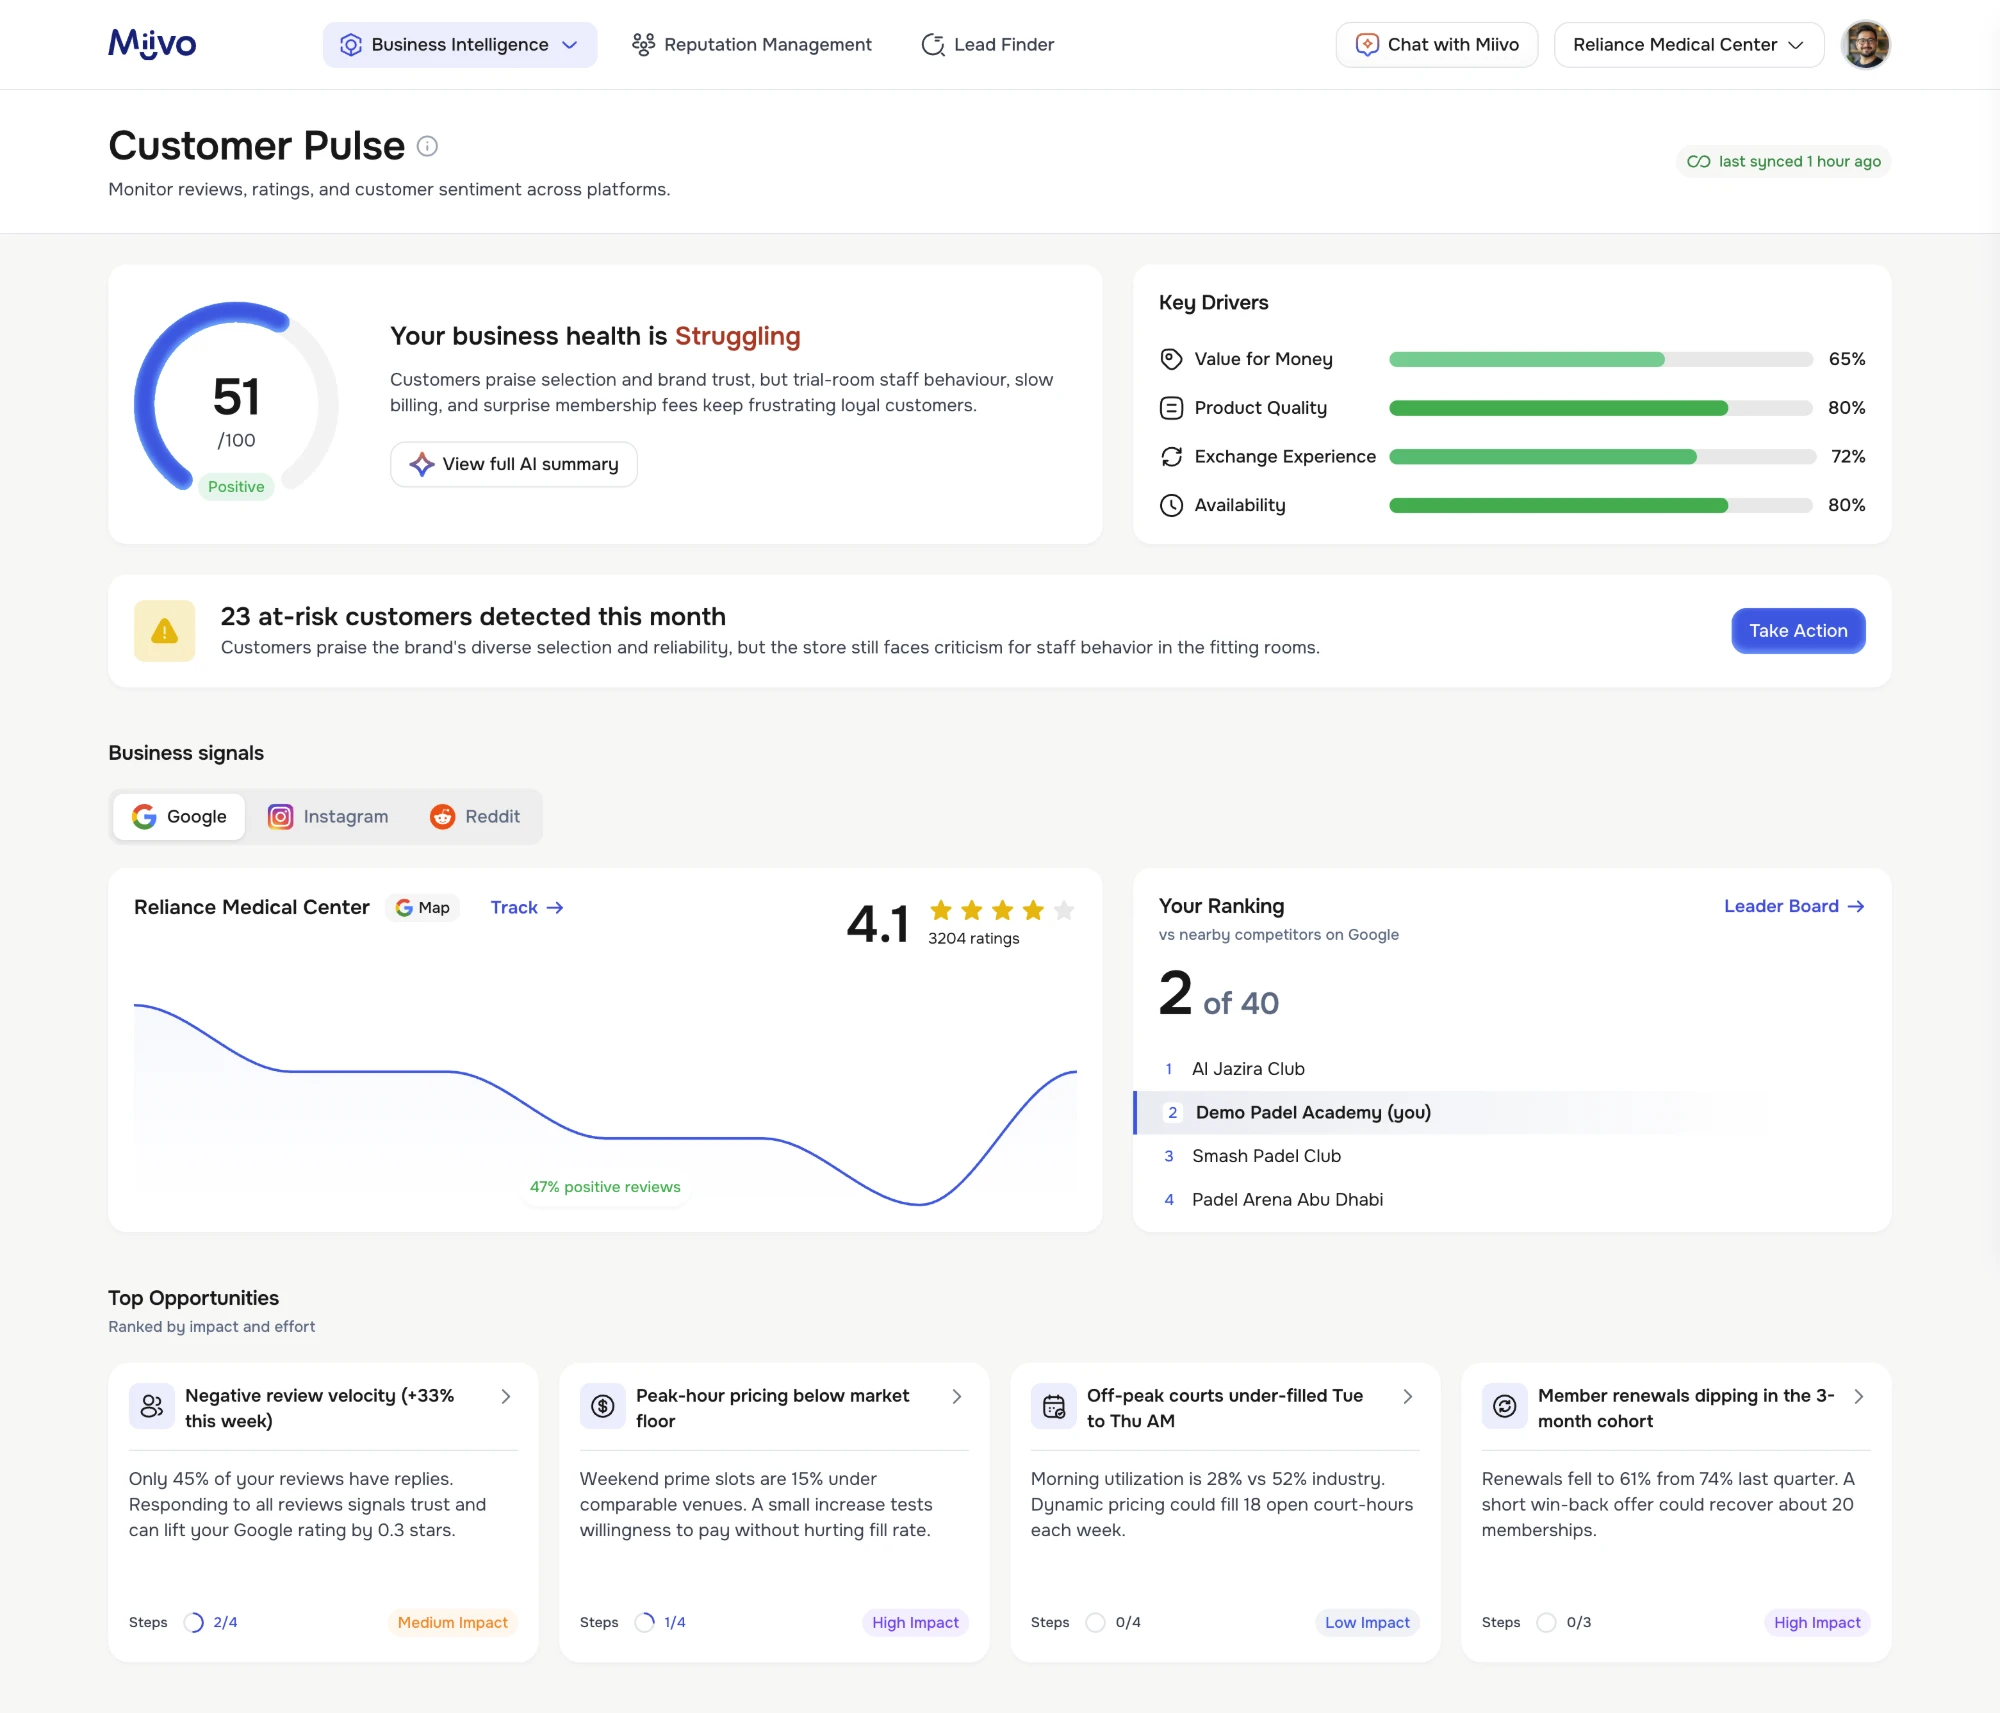
- Health scoreA score with an AI summary of what customers say.
- Key driversWhat lifts or lowers the score.
- Every channelGoogle, Instagram and Reddit in one place.
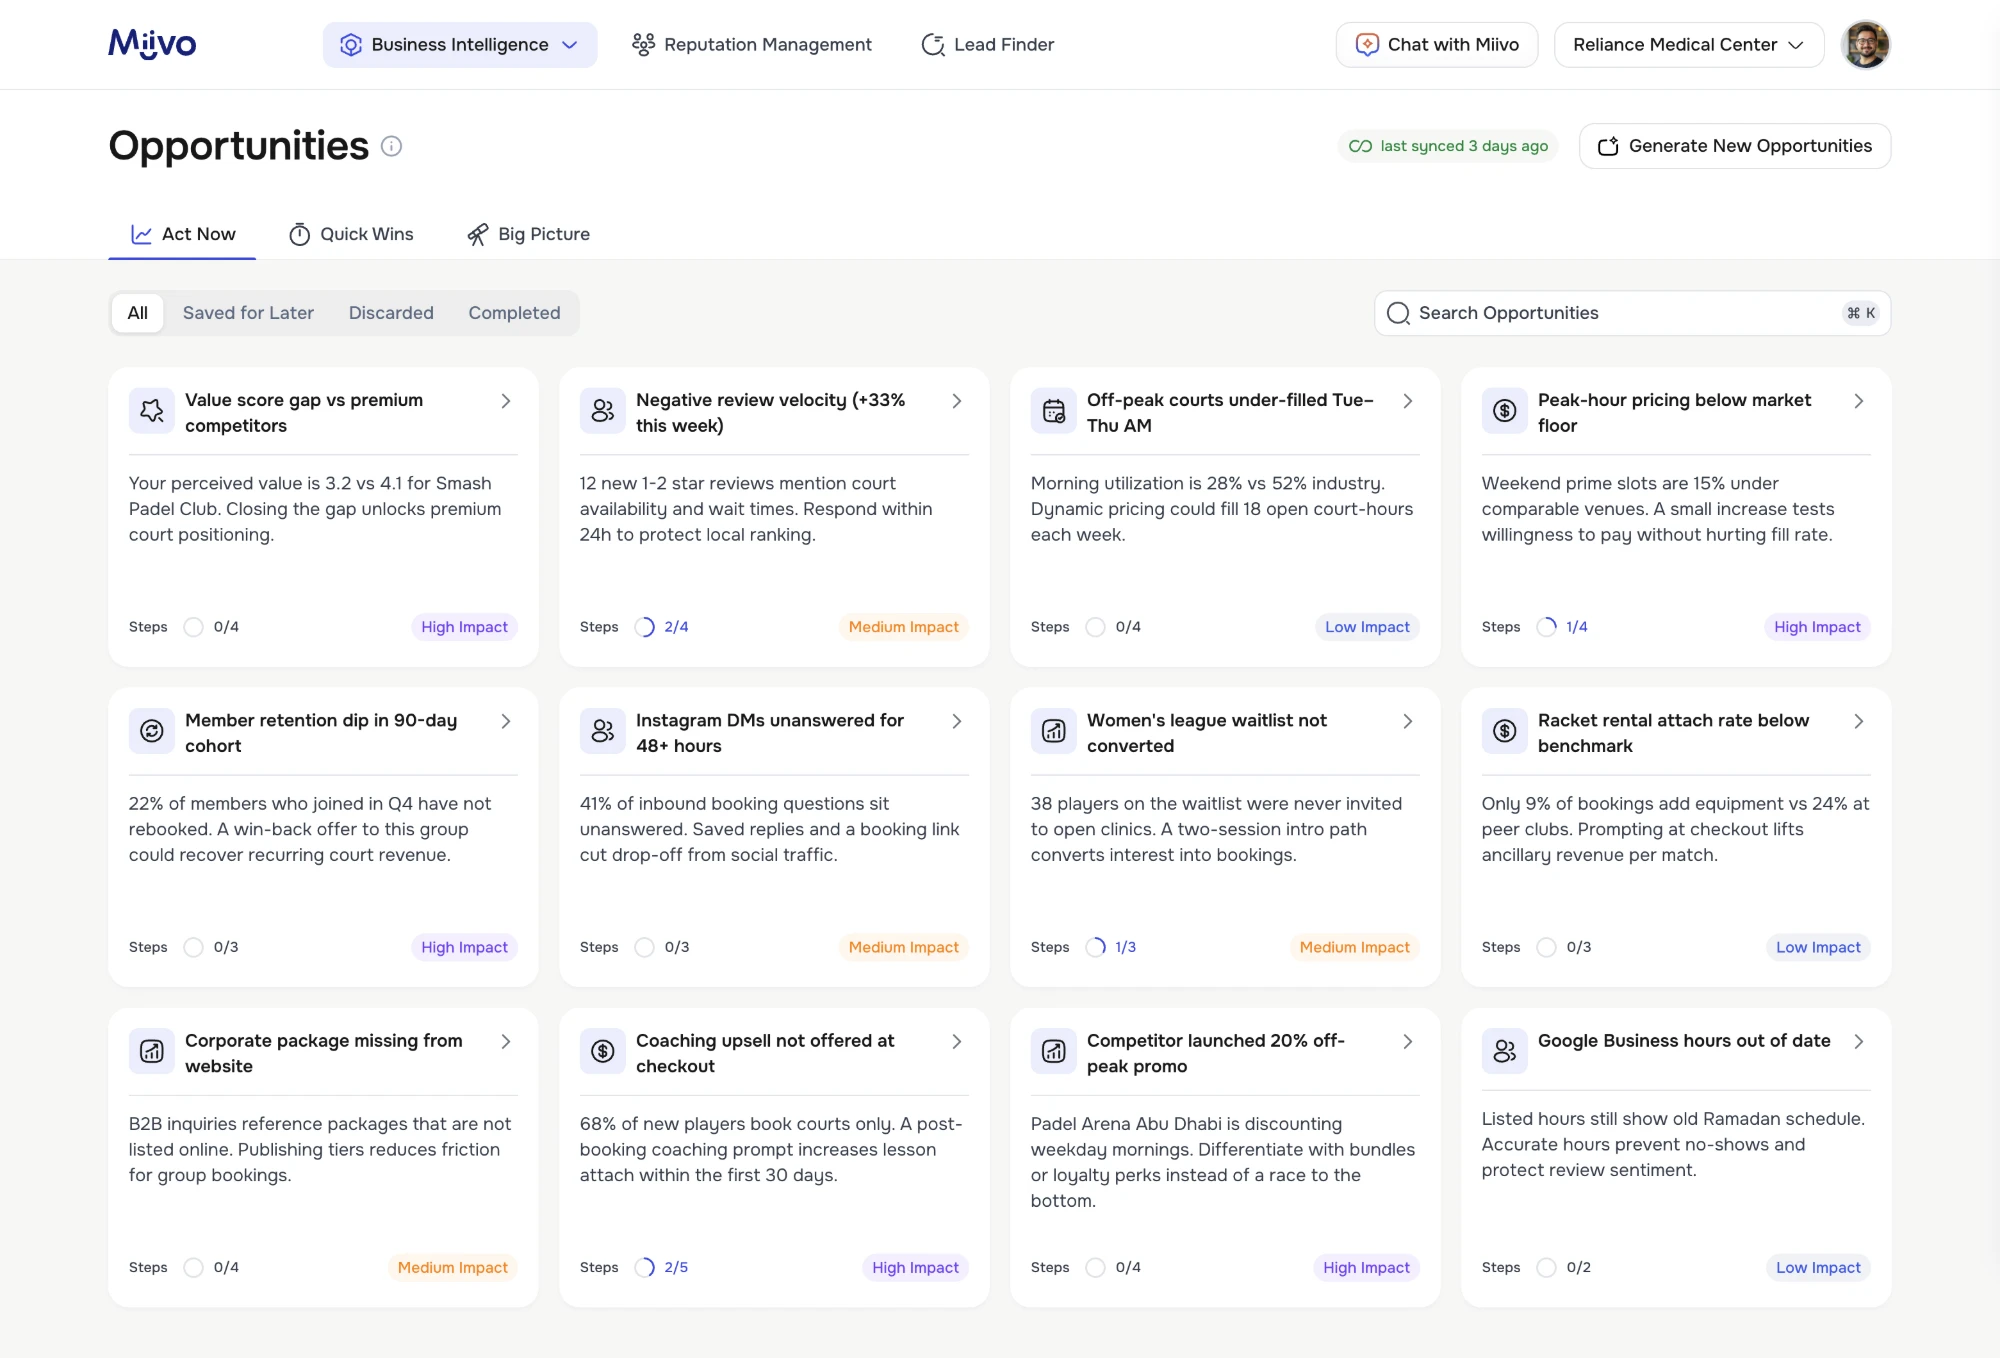
- Effort tabsAct Now, Quick Wins and Big Picture group suggestions by effort.
- Impact tagsEvery suggestion shows its likely impact.
- Step progressHow far each action has gone.
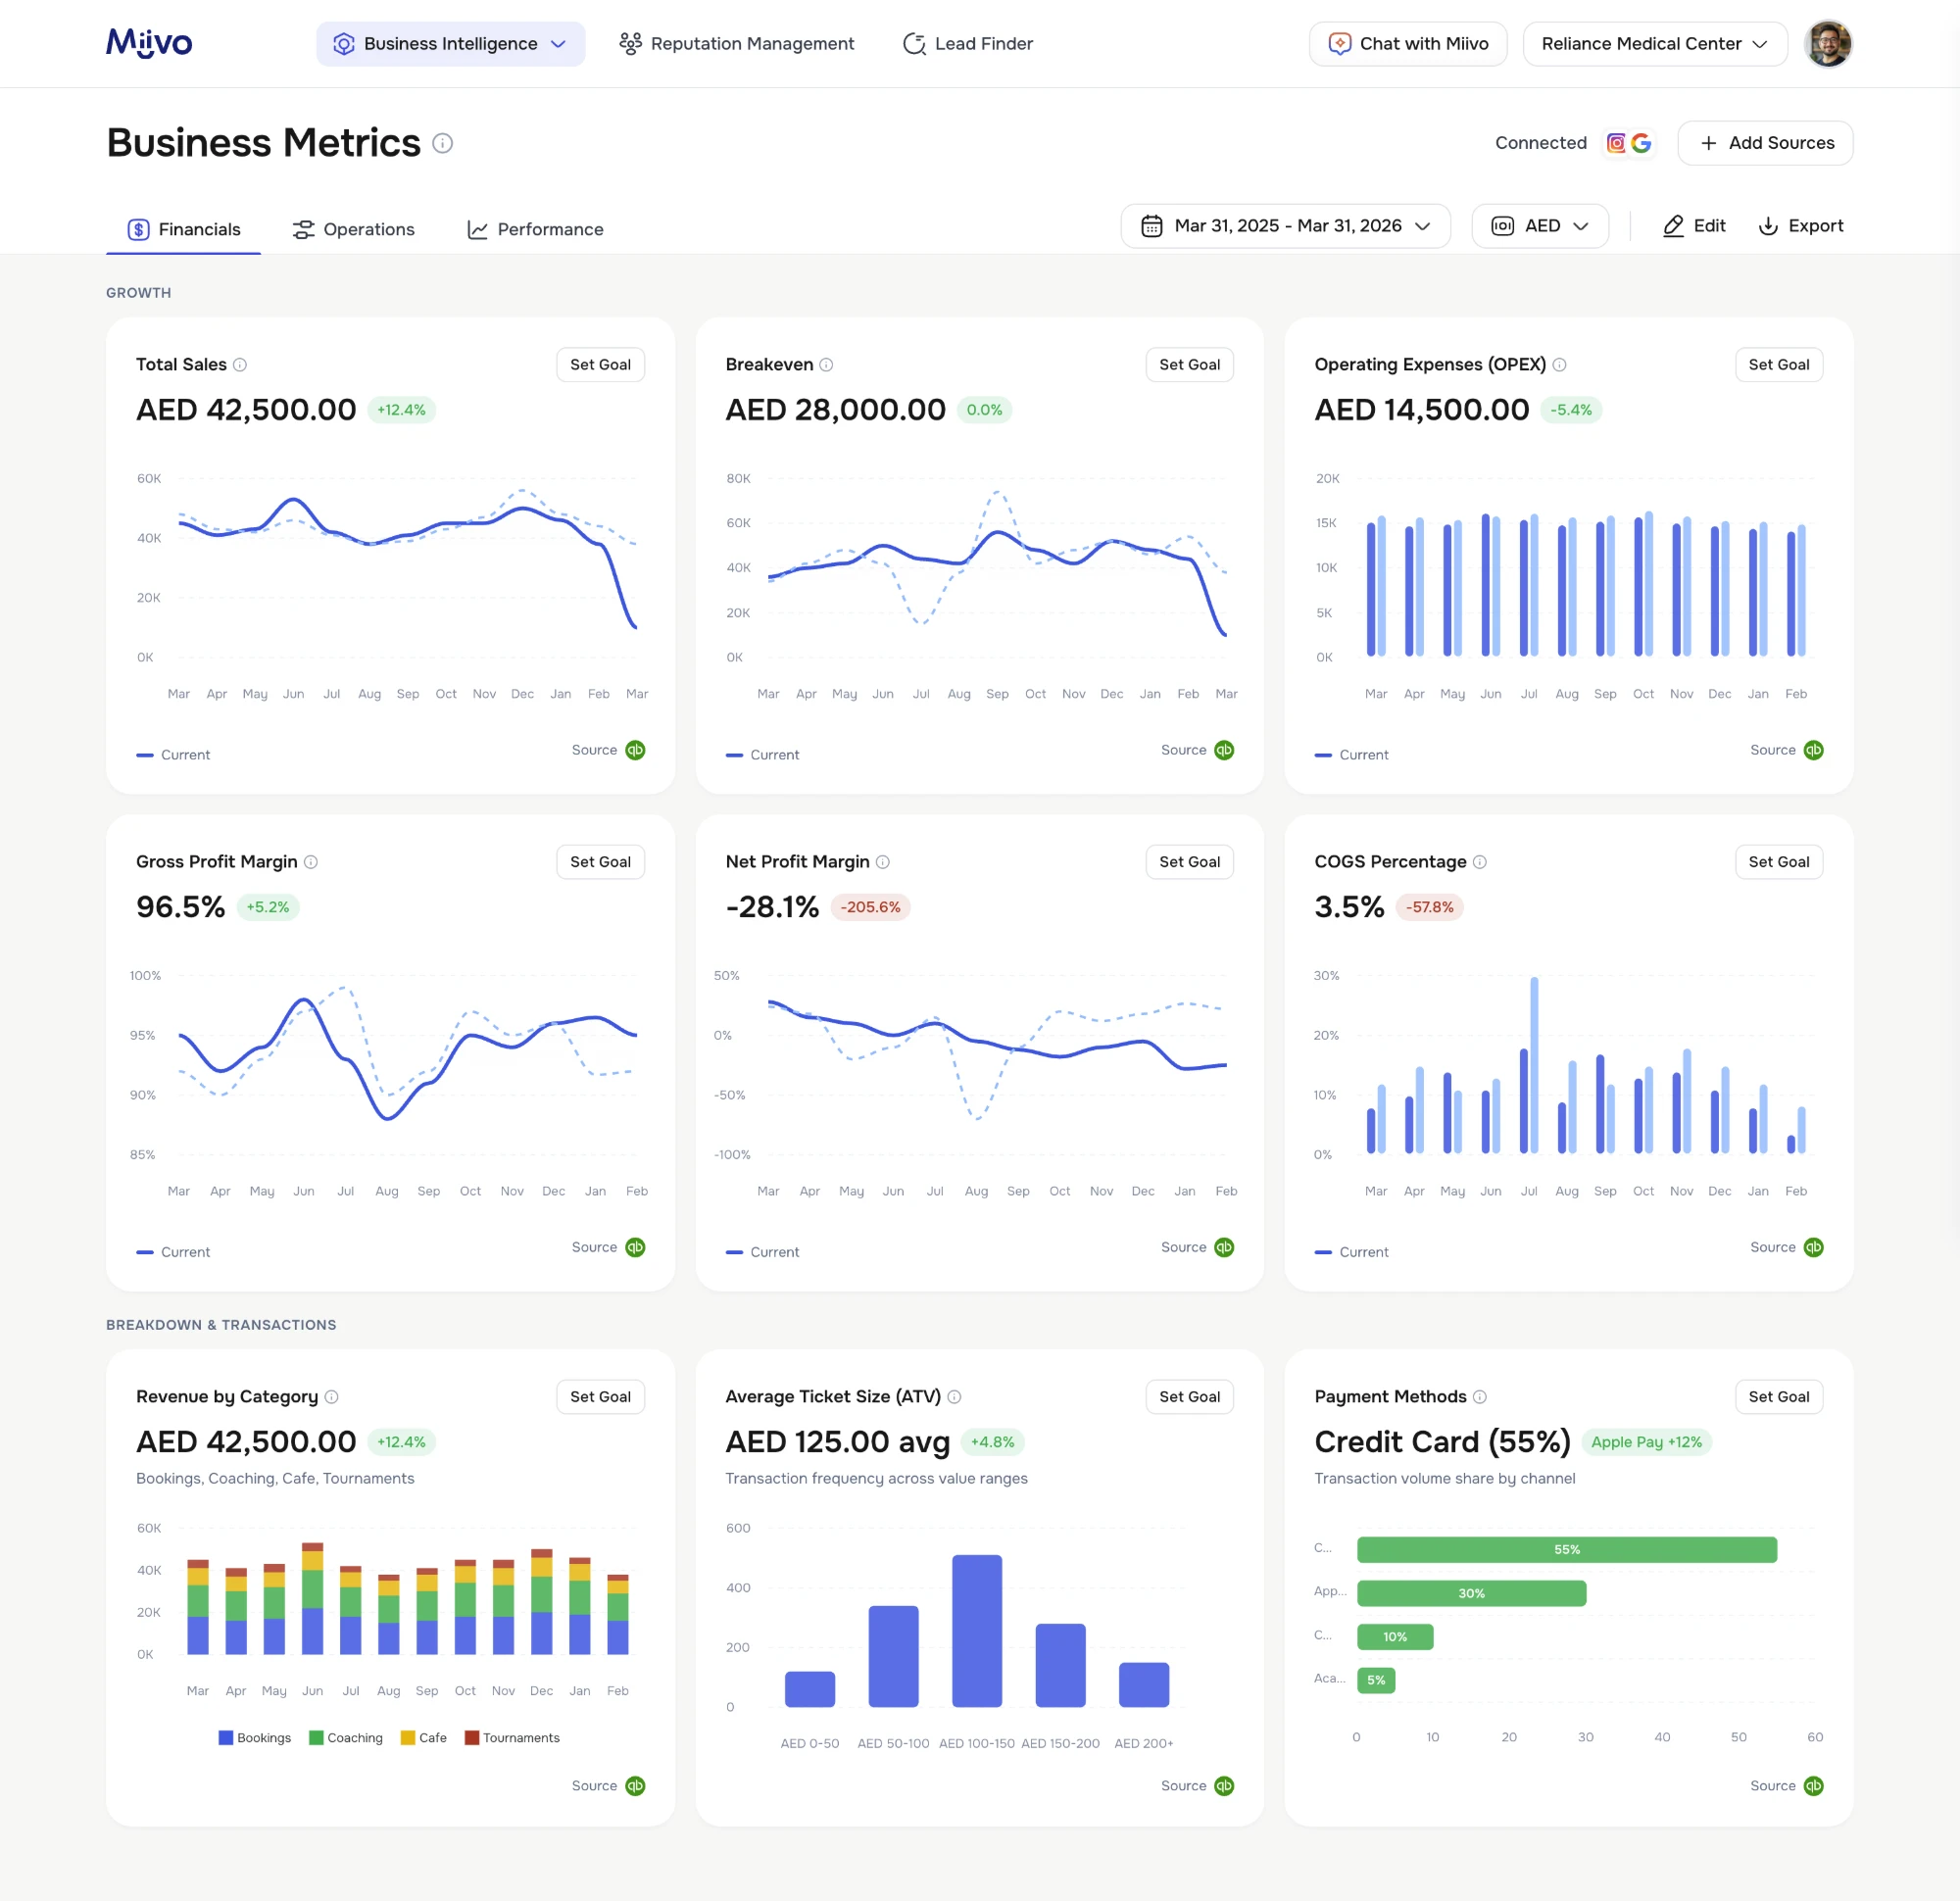
- Key numbers firstEach card leads with the number and its change.
- Linked sourcesEach chart shows where its data comes from, linked through integrations.
- Grouped chartsCharts sit under Growth and Breakdown.
Added as Miivo grew Proposed by the co-founders
Reputation management
Bring reviews from every channel into one place to track and respond.
Lead Finder
Help owners find and reach new customers, beyond their existing base.
SEO tools
Show search visibility next to performance, inside Business Intelligence.
Expanded product flow
Journey 1/3
Onboarding fills in business details from Google Maps, with a split layout that previews Miivo’s value.
Journey 2/3
Metrics, Opportunities and Customer Pulse merged into Business Intelligence, grouped by how they relate.
Journey 3/3
Opportunities show urgency, effort and impact, so users know what to act on first.
Other core workflows
Beyond the feedback, the co-founders’ plan added Reputation management and Lead Finder, taking Miivo from understanding the business to managing its reputation and finding new customers.
Design decisions and trade-offs
-
Opportunities
Considered
A kanban board by status. Good for tracking, weak at showing what mattered most.
Chose
Tabs by effort with impact tags, so owners see what to act on first.
-
Metrics
Considered
Keeping every metric and insight on one screen. Complete, but heavy to read.
Chose
A decluttered view with the key numbers first, linked to the related Opportunities.
-
Navigation
Considered
A sidebar of every feature. One click away, but a long, flat list.
Chose
Three top-level areas, with Business Intelligence grouping its tools. The cost: one extra click.
Engagement across Miivo
Compared with the previous six months, people spent more time on Miivo, viewed more pages and returned more often.
- 9 min
Time spent in Opportunities
Active time in sessions that opened Opportunities, 3× the product average.
- 3×
Longer active time
Active time per session rose from 28 to 84 seconds.
- +59%
Pages per session
Sessions went from 1.5 to 2.4 pages on average.
- 24%
Returning users
Share of sessions from returning users, up from 17% in the previous period.
Microsoft Clarity data.
Design system
Building a shared design system
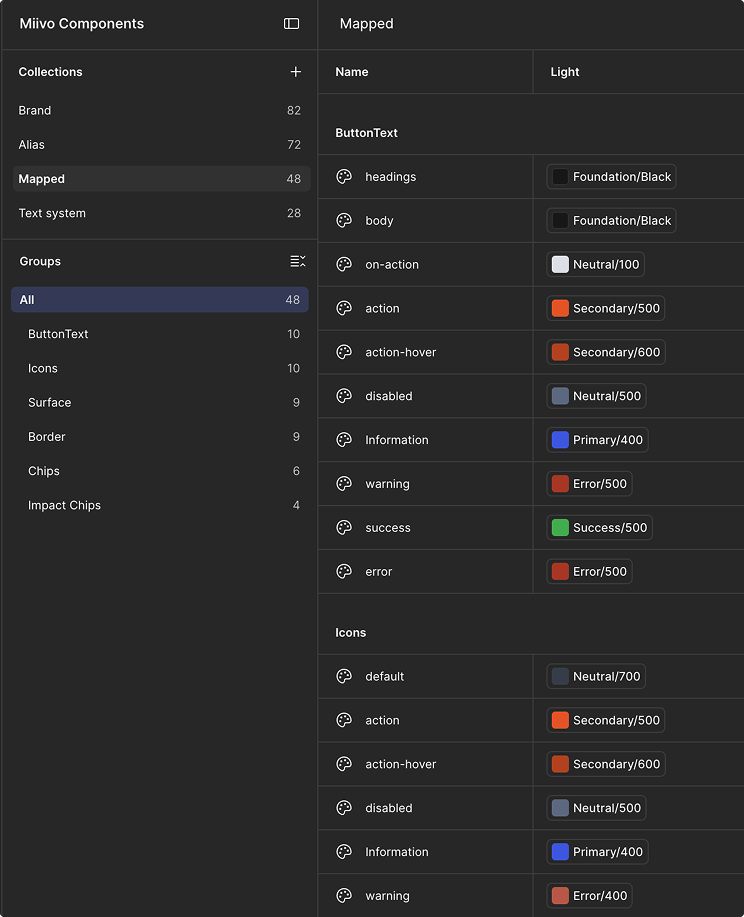
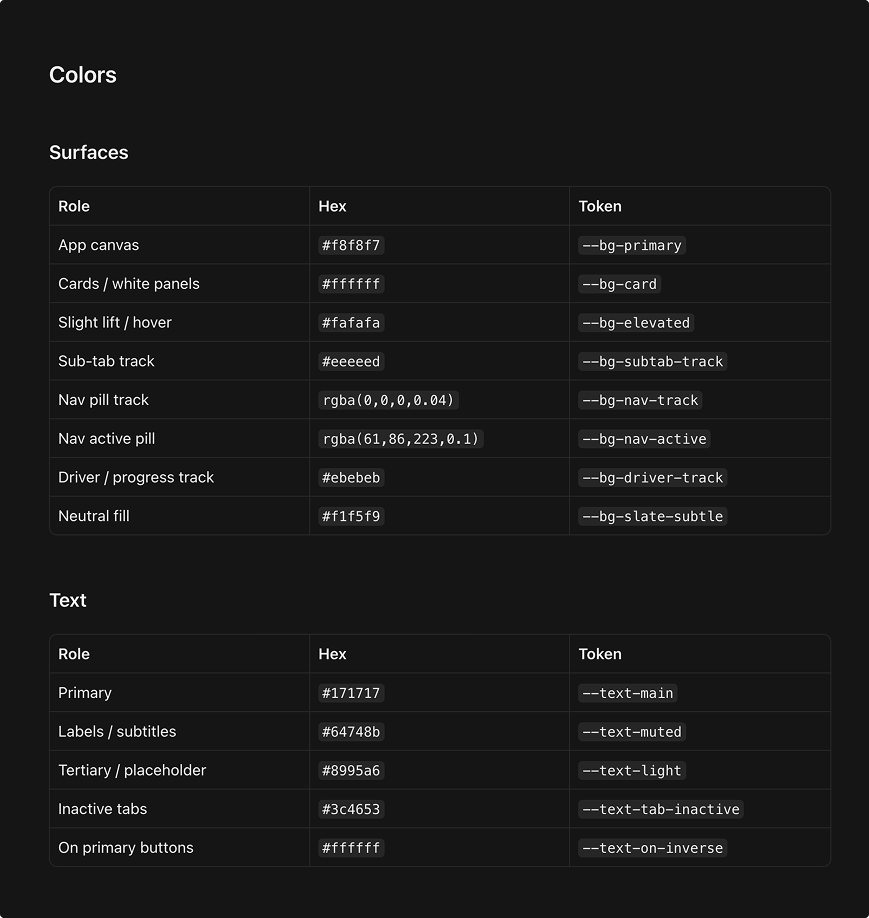
I built a base system in Figma with the development team and carried it into code with Cursor. Shared colour, type and surface tokens, alongside reusable components, gave new tools a consistent starting point.
Website
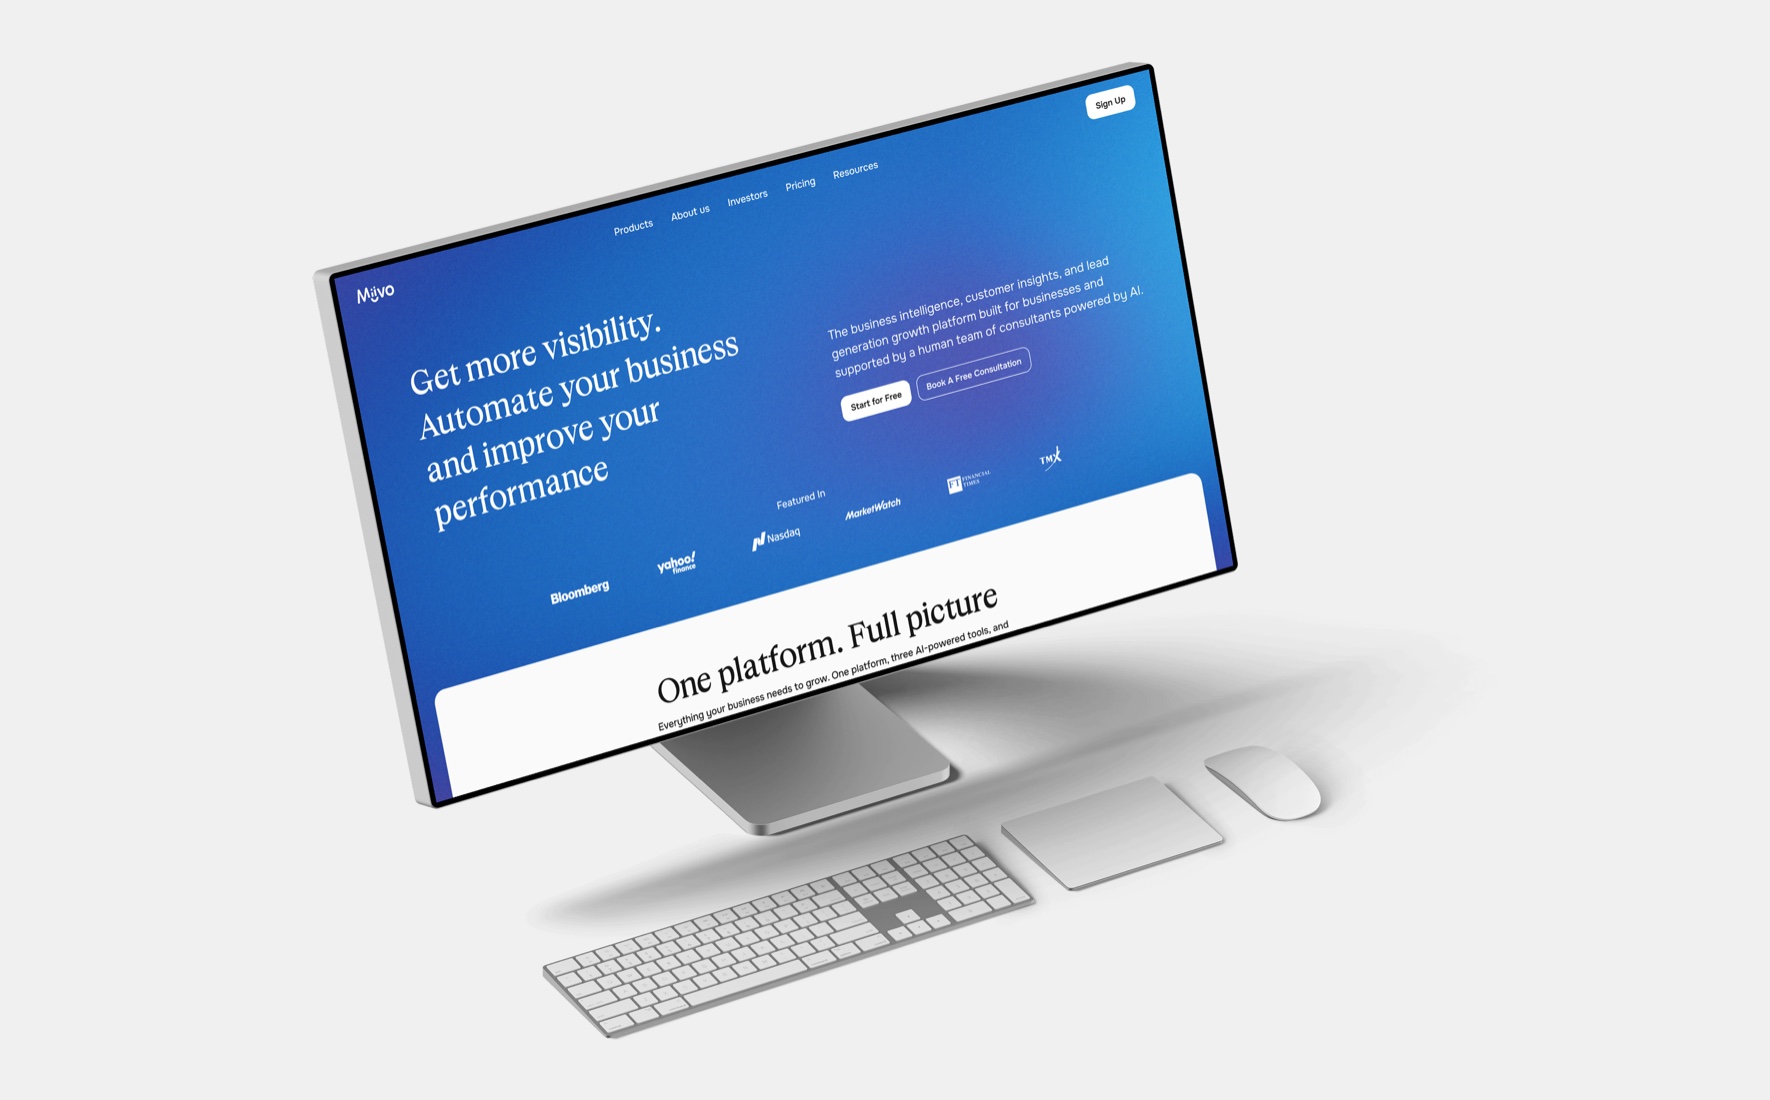
I designed the website alongside the product, evolving the early AI-advisor positioning to explain the broader tools and use cases as Miivo expanded.
Where Miivo stands today
From the first prototype to today, Miivo has grown into a business operating across three regions.
- 4,000+
Signups
Total signups to Miivo to date.
- $40,000+
Recurring revenue
Monthly, company-wide, including services.
- 3
Regions
Middle East, Europe and North America.
Company figures include Miivo’s services and reflect the whole business, not a single design change.
Reflection
Owning one product from the first prototype to its expansion showed me how design decisions play out over time.
Working across functions
Founders, the PM and engineers had needs at once. Prioritising them together showed what to build first.
Not a linear path
Features kept being rethought, down to small details, as each round of feedback changed what we knew.
The customer’s view
Better decisions came from thinking like an SME owner in their daily context, not from my own assumptions.